 Alex Dudov

Amazon has quietly built one of the most compelling growth stories in tech - and the stock hasn't caught up yet. With chip revenue surging past $10 billion annually and the share price sitting near decade-low valuation territory, AMZN is drawing attention from traders watching for a technical setup that matches the fundamental case. Here's what the chart and the numbers are saying right now.
Amazon's Chip Revenue Crosses $10B With Stock Near Key Support
Amazon (NASDAQ: AMZN) has pulled back sharply on the weekly chart, recently touching the $210 area where price is interacting with the 100-period exponential moving average. According to analyst Mike Investing, Amazon's chip business is now generating more than $10 billion in annual recurring revenue and growing over 100% year over year - a figure that puts AMZN in direct conversation with dedicated semiconductor names, even as the stock trades at historically compressed levels.
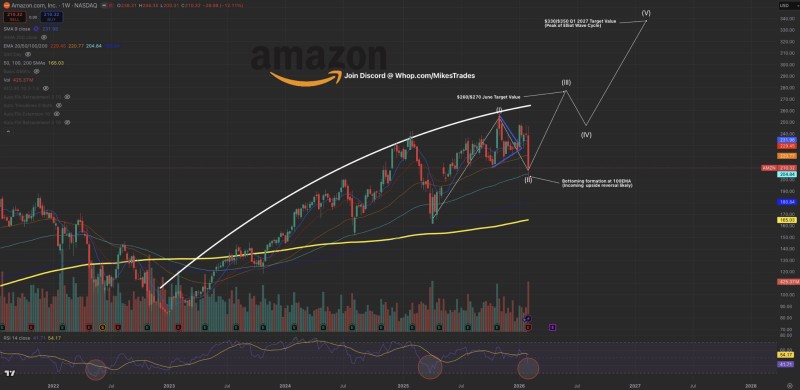
The weekly chart outlines a broader upward channel with Elliott Wave projections pointing first toward the $260-$270 range, and further out toward the $330-$350 region. A potential bottoming formation near the 100 EMA suggests renewed upside momentum could emerge if support holds, with a scenario where Amazon stock defends key support levels before targeting higher resistance zones remaining technically intact for now.
Amazon's chip business is now generating more than $10 billion in annual recurring revenue and growing over 100 percent year over year.
Decade-Low Valuation Meets Building Bullish Momentum
Valuation has become one of the most discussed angles in the AMZN conversation. The stock is now seen by many as sitting at Amazon trading at one of its lowest valuation levels in over a decade, raising the question of whether the market has yet to fully price in growth from AWS, advertising, and custom silicon. That combination of cheap-by-history pricing and accelerating chip revenue is what's driving renewed interest from both fundamental and technical traders.
Momentum indicators support that view in the near term. Prior analysis points to building bullish momentum toward the $275 resistance area, with sustained strength above current support potentially re-igniting trend continuation. The convergence of technical structure, valuation compression, and an accelerating chip growth narrative gives the current setup meaningful weight. That said, a breakdown below critical support would shift the picture quickly - and traders are watching those levels closely.
 Alex Dudov


