 Saad Ullah

The S&P 500 ETF is once again approaching a critical resistance level, and this time the price action looks familiar. The chart shows SPY rallying into the 661-663 area - a zone that has repeatedly acted as a ceiling on the weekly timeframe. Analyst Cole pointed out that this setup mirrors what played out in April 2025, when a relief rally into key moving averages gave way to a sharp selloff.
A relief rally into key moving averages was followed by a selloff - the same sequence is now unfolding at the same resistance zone.
A Repeated SPY Structure at the Same Zone
The chart reflects an almost identical sequence: a decline, then a recovery into the weekly 9/34 moving average zone. In the prior instance, that rally failed at this same region and led to a steep drop. Now SPY is again testing the 661-663 band, reinforcing just how significant this level has become as a technical ceiling.
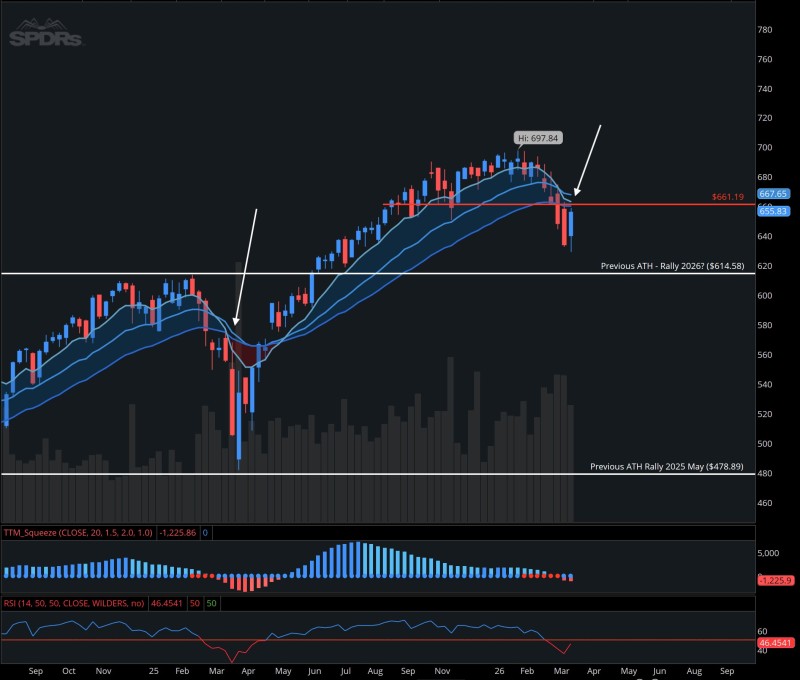
Recent analysis also shows how SPY has been compressing below the 200-day moving average near this zone, a sign of weakening structure as the downtrend tightens its grip.
SPY is compressing below the 200-day moving average near 661 - a signal that bearish structure remains intact rather than reversing.
Where SPY Price Meets Resistance
Price action shows a rejection from the recent high near 697, followed by a move back into the current resistance zone. The structure suggests a familiar sequence:
- A rally into resistance
- Failure to hold above key moving averages
- Continued pressure near the same ceiling
This aligns directly with the setup described by Cole, where resistance defines the current structure rather than support. The pattern of persistent selling pressure on SPY adds weight to the idea that this zone is unlikely to give way easily.
The SPY Scenario and Key Levels to Watch
The analysis outlines a conditional outcome: if the pattern repeats, SPY could reject at this level and move toward 615 - a level corresponding to a previous all-time high. Broader technical projections also point to downside scenarios in the low 600s if bearish structure holds.
Resistance zone661-663Prior high reference~697Potential downside target~615
Broader S&P 500 analysis points to a possible 10% drop toward $612 if the EMA cross pattern that triggered the prior selloff reasserts itself at current levels.
If SPY rejects here again, the downside case toward 615 remains on the table - consistent with the structure that played out last April.
A Critical Decision Zone for SPY
The chart presents a clear inflection point. If rejection occurs, the structure remains consistent with the prior pattern. If price breaks above the 661-663 zone with conviction, the comparison no longer holds and the narrative shifts. For now, SPY is testing a well-defined ceiling, and the next move will likely determine whether this pattern continues to track what came before.
 Saad Ullah


