 Marina Lyubimova

SPY is showing a clear reaction higher after entering a predefined buy zone, with price responding exactly where the structure suggested it would. Analysts at Elliottwave Forecast noted the reaction was already in play once SPY entered this zone, reinforcing the idea that selling into that area ran against the prevailing structure. The move highlights how technical analysis continues to guide the S&P 500, as buyers step in at a high-probability area rather than during breakdown conditions.
The Zone That Triggered the SPY Bounce
The chart shows SPY declining from recent highs into a marked "blue box" area, identified as a high-frequency reaction zone.
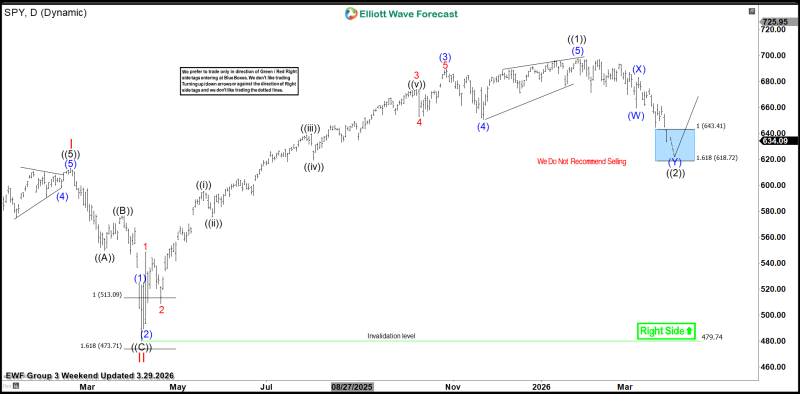
This region sits roughly between the 1.0 and 1.618 Fibonacci extension levels, around the 643-618 range.
Price did not drift through this zone. It reacted immediately.
Price entered the defined buy zone and reacted immediately, confirming that the corrective move had reached its intended depth rather than accelerating into a breakdown.
That behavior is consistent with how structured corrections tend to unfold. Instead of breaking down impulsively, the index found support within a projected area and began to reverse, suggesting that the corrective move may have reached its intended depth.
A Pullback That Fits the Broader SPY Trend
The broader structure on the chart remains intact. SPY's decline appears as part of a corrective sequence rather than a trend reversal, with the move into the blue box aligning with a typical multi-leg pullback. This type of behavior is consistent with Elliott Wave patterns, where corrections often resolve in defined zones before continuation.
Corrections in well-structured markets tend to resolve within defined zones rather than spiraling into breakdowns, and SPY's reaction here fits that template almost precisely.
Recent market analysis also points to similar setups, where SPY pullbacks into key support areas occur while the larger trend remains valid, rather than signaling a full breakdown. The key takeaway is not just that SPY bounced, but that it bounced where it was expected to.
Where SPY Structure Starts to Matter More Than Momentum
At this stage, the chart reflects a transition point. The decline into the buy zone shows that sellers were in control during the pullback, but the immediate reaction suggests that control may be shifting. The chart explicitly notes that selling is not recommended within this region, reinforcing the idea that this area is designed for accumulation, not distribution.
The structure now presents a clear framework:
- Price entered the defined buy zone and reacted higher
- The move aligns with Fibonacci extension targets between 643 and 618
- The broader trend has not been invalidated
This combination suggests that the market is respecting structure rather than breaking it.
The Reaction That Traders Are Now Measuring
The focus now shifts from the bounce itself to what follows. A sustained move higher would confirm that the correction has completed and that the broader S&P 500 trend is resuming. On the other hand, a failure to build on this reaction could imply that the structure is evolving into a more complex consolidation.
For context on how this fits the bigger picture, the S&P 500 Elliott Wave outlook for 2026 has been flagging the likelihood of a corrective sequence after an 11-month rally, which adds weight to the idea that this bounce occurs within a larger, still-developing pattern.
For now, SPY stock is doing exactly what structured technical setups are designed to anticipate, reacting at the right place, at the right time, with precision that keeps traders focused on levels rather than noise.
 Marina Lyubimova


