Usman Salis
The market has once again reversed bearish sentiment. As Lance Roberts noted, after a sharp drop the S&P 500 pushed to fresh highs. The chart confirms this move, with price near 7,023 while both the 50-week (~5,567) and 200-week (~5,234) moving averages continue trending upward beneath it.
The SPX Trend That Keeps Reasserting Itself
The chart highlights a long-term bullish structure, with price consistently holding above key moving averages. The 50-week moving average remains above the 200-week moving average, and both continue to slope higher.
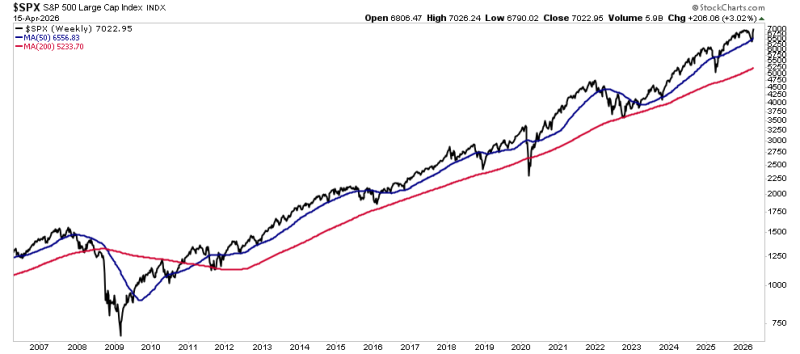
The recent decline failed to break that structure. Instead, price held its trend and resumed higher, continuing the pattern of higher highs and higher lows. This confirms that the broader trend remains intact rather than transitioning into a bearish phase.
SPY Slips Below 200-Day Moving Average as S&P 500 Structure Breaks Down captured what the breakdown looked like when it was most concerning - making the subsequent recovery to new all-time highs a more meaningful reversal of that narrative than a routine bounce would be.
Why a SPX Pullback Would Fit the Current Structure
The move to new highs shifts the technical backdrop. After breaking out, markets often revisit prior resistance to establish it as support - and that kind of move would not contradict the trend, it would reinforce it.
The recent rally has been strong enough to create short-term exuberance, and a pullback would allow momentum to reset. As long as price remains above rising moving averages, such a move would likely be viewed as consolidation rather than weakness.
SPX at 6,624: S&P 500 Eyes Pullback Before Mid-Year Rebound outlined the pullback-then-rebound sequence that has now largely played out, showing how the corrective phase that preceded the current breakout was anticipated within the broader cyclical structure rather than representing a trend change.
Where the SPX Bear Case Lost Ground
The chart suggests that the probability of a larger bear market has diminished for now. Price is making new highs, and long-term support remains well below current levels at the 50-week (~5,567) and 200-week (~5,234) averages. That does not eliminate volatility - but it changes how volatility should be interpreted.
Recent weakness now appears to be part of a broader continuation pattern rather than the start of a sustained downturn. The signal beneath the sentiment is straightforward: when bearish sentiment becomes excessive within a rising trend, it often sets the stage for the next move higher.
 Usman Salis