Saad Ullah
⬤ The S&P 500 has traded within just 2.7% during the first 41 trading days of 2026, the tightest opening range since records began in 1928. As The Kobeissi Letter highlighted, the reading in log terms sits near 0.0264, well below anything seen in most historical periods. Charts covering multiple decades confirm how far outside the norm this compression really is.
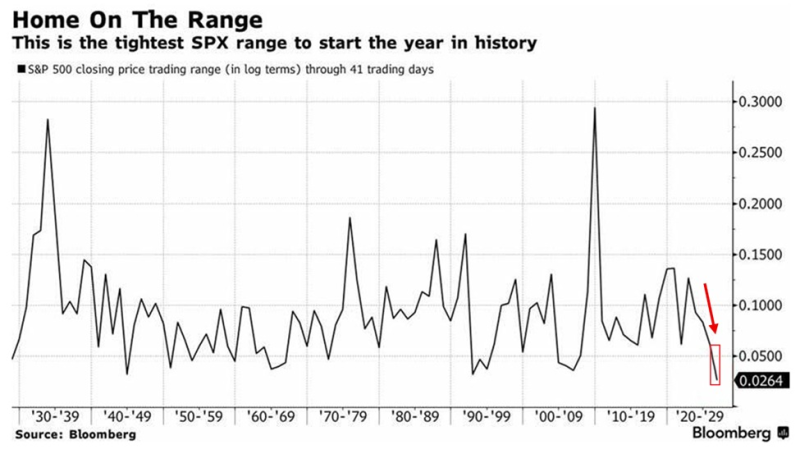
⬤ Historical data shows that even traditionally quiet markets tend to see the S&P 500 move more than 5% through the January-February stretch. The current 2.7% figure is not just below average, it sits at the outer edge of what the record books have ever captured, making this one of the most unusual openings the index has ever produced.
The 2026 trading range is roughly 1,200% narrower than the 2008 period and about 450% narrower than the 2020 pandemic range.
⬤ The contrast with past stress episodes is stark. The 2008 financial crisis pushed the early-year range to around 35%, while the 2020 pandemic shock produced a range near 15%. Against those benchmarks, the 2026 period looks almost frozen, with the index barely budging while history suggests it should be moving far more actively.
⬤ Analysts warn that the calm at the headline level does not tell the whole story. Individual stocks within the S&P 500 have been pulling in different directions, reflecting sector rotations and company-specific swings that simply cancel each other out at the index level. This kind of surface stability can mask a significant amount of activity underneath.
⬤ Historically, periods of extreme compression like this tend to attract attention precisely because they rarely last. When the balance between buyers and sellers eventually shifts, the index typically makes up for lost movement quickly. The 2026 opening has set a record for calm, but tight ranges have often been the quiet before a larger directional move.
 Saad Ullah