 Alex Dudov

⬤ NASDAQ has bounced back on the hourly chart, recovering toward the 24,900 area after a prior pullback. The price structure shows a short-term higher low taking shape, pointing to improving momentum. Even so, the index is still trading below a descending trendline that continues to cap upside. According to Forex Sinyal Merkezi, the current move is best read as a reaction rally, not a confirmed trend reversal.
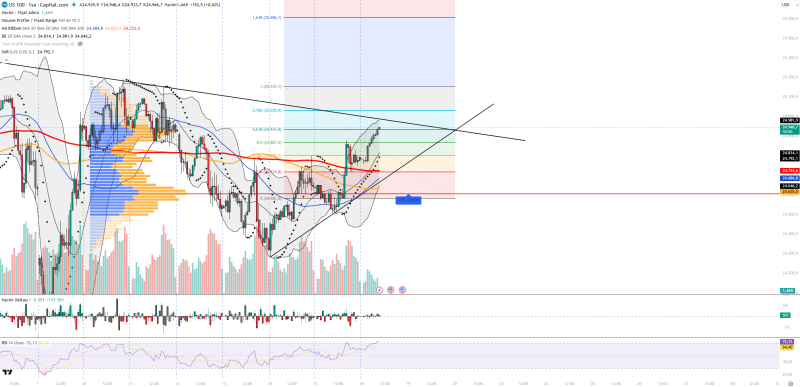
⬤ The technical setup shows US100 bouncing from the 24,400-24,600 region and now trading above the key Volume Profile point of control near 24,660. This pattern echoes what was covered in NASDAQ Price Analysis: Index Tests Key 25,000 Resistance After Rebound From 24,500, where the index similarly pushed toward the 24,900-25,000 zone. Volume Delta data confirms buyers are leading in the short term.
⬤ Momentum indicators back the recovery but fall short of confirming a breakout. RSI is trending upward with strength, Bollinger Bands show price near the upper band, and Parabolic SAR has flipped higher. Resistance clusters remain at 24,980, 25,030, and 25,150, with the descending trendline still intact. Comparable setups were flagged in NASDAQ Rebounds to 24,800 but Bulls Still Need to Clear 24,900, where recovery attempts stalled at similar levels.
⬤ On the bigger picture, NASDAQ stays under pressure from macro headwinds including elevated interest rates and U.S. dollar strength. As noted in Nasdaq Stalls at 25,100 as Range Tightens Between 24,650 and 25,100, the market has struggled to break free from this range. Short-term buying has picked up, but the broader structure still demands a clean break above key resistance before momentum can shift decisively higher.
 Alex Dudov


