Saad Ullah

Three decades of data tell a story that one chart makes impossible to ignore. Europe's share of global semiconductor sales has gone from a peak of 23.4% in 1998 to just 6.9% in 2025, a record low with no sign of a floor forming. Meanwhile the Americas have climbed to 32.2%, their strongest reading since 1997. That divergence isn't just a regional trade statistic. It's the structural backdrop behind where capital, manufacturing leverage, and AI investment have been flowing.
Econovis flagged the chart, and the trend it captures has direct implications for how SPY is being driven right now.
From a pure chart structure perspective, Europe's share line is a textbook long-term downtrend. Lower highs after the late-1990s peak, lower lows that persist without interruption into 2025, and every bounce that looked like stabilization eventually rolled over into a fresh decline.
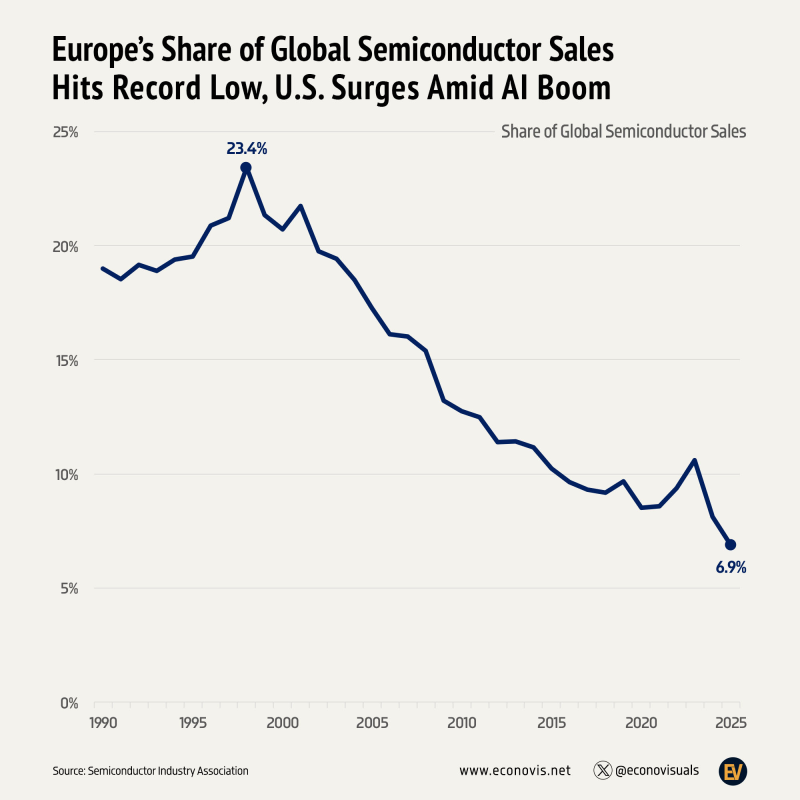
Each of those levels looked like potential support at the time. None of them held. The move below 10% and into 6.9% doesn't look like consolidation. It looks like continued structural erosion with no recovery pattern in sight.
Tech stocks have already pushed the S&P 500 15% higher than the equal-weighted index in 2025, which reflects exactly the kind of leadership concentration that Europe's declining chip share helps explain. The companies benefiting from semiconductor dominance are overwhelmingly American, and SPY's weighting reflects that reality.
The flip side of Europe's decline is the Americas' rebound. Rising from a lower base back to 32.2% in 2025, the highest level since 1997, the chart captures how much AI-driven investment has concentrated semiconductor activity in the US. Chip design, AI infrastructure buildout, and cloud spending are all running through American firms and their select Asian manufacturing partners.
Europe's shrinking share of semiconductor sales and the Americas' rebound fit the same broader trend that has supported US equities and reinforced the leadership role of AI-exposed companies inside the S&P 500.
That's the mechanism connecting a long-term regional market share chart to daily SPY price action. The S&P 500 is increasingly a semiconductor and AI index in practice, even if it's technically a broad market benchmark. AI stocks have driven most of the S&P 500's growth since the ChatGPT launch, and the chip market share data shows why that leadership has been so durable.
SPY Stock Structural Tailwind Tied to Semiconductor Leadership That Europe Can't Reclaim Quickly
The chart carries one important limitation worth noting: there are no moving averages or volume indicators, so the analysis stays anchored to structure rather than traditional technical signals. What structure alone shows is trend persistence with no breakout and no recovery pattern on the European side.
As long as semiconductor leadership remains concentrated in the US and AI spending continues to favor American firms, the broader S&P 500 can keep drawing support from the same structural imbalance this chart captures.
Rebuilding semiconductor market share from 6.9% is not a quarters-long project. Europe's CHIPS-equivalent initiatives exist, but the gap between 6.9% and where the continent was 25 years ago represents decades of compounding investment decisions that don't reverse quickly. Nvidia's CEO has publicly warned that the US must maintain AI leadership, and the chip market share data suggests that leadership is already structurally embedded in ways that go well beyond any single company's position.
For SPY, the implication is straightforward. The index keeps concentrating around the same names that are winning the semiconductor and AI race. The chart showing Europe's record low share isn't a European story. It's a mirror showing exactly where the opposite of that decline has been accumulating.
 Saad Ullah