 Artem Voloskovets

⬤ The U.S. Dollar Index is approaching a critical technical juncture as it retests the lower line of a long-term parallel channel, highlighting a potential inflection point in macro markets. Price action has brought the index back toward this support after extended trading within the channel's range. The weekly chart displays historical touches on the channel's base in 2011, 2021, and now in 2026, illustrating the persistence of this structural trend over decades.
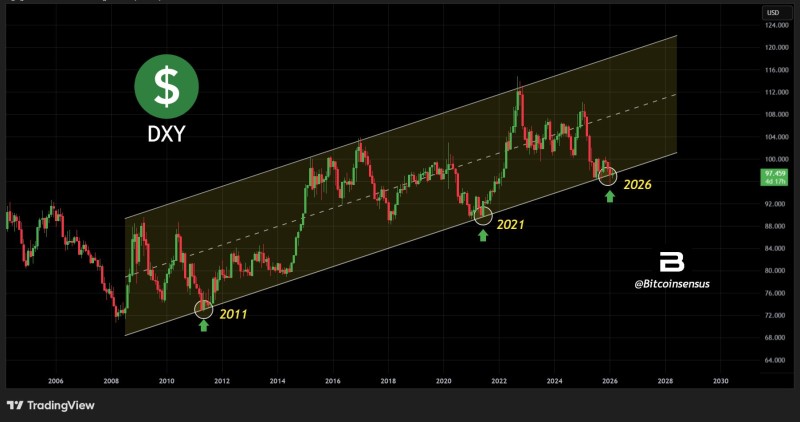
⬤ Historical patterns show DXY bouncing off the lower boundary of its long-term rising channel multiple times, each preceding renewed strength. In prior cycles, support tests in 2011 and 2021 were followed by rebounds higher, reinforcing the significance of this technical band. The index currently trades near 97.45, close to the channel's lower trendline. As highlighted in U.S. Dollar Index Holds 14-Year Uptrend Support, the dollar has maintained structural integrity even during pullbacks, suggesting this channel plays a central role in defining its broader trajectory.
⬤ The near-term movement of DXY mirrors other coverage of dollar weakness, where price has slid to gap zones near 97.33-97.46 after a sharp weekly decline, emphasizing how critical support levels are currently being tested. According to recent market analysis, "The interaction around this multi-year channel boundary underscores the role of long-term structure in shaping the dollar's behavior." If the Dollar Index continues to hold within its structural support, historical patterns suggest continued resilience, but a decisive break lower could spell broader shifts in currency markets.
⬤ A weaker dollar often signals easing financial conditions and may lift risk assets and commodities, while renewed strength can tighten liquidity and pressure other markets. The DXY US Dollar Index: 10-Year Rally Pattern shows how these structural levels have historically influenced cross-asset dynamics. Whether DXY rebounds from this lower trendline or breaks below it could signal a change in macro risk dynamics. The DXY Dollar Index Slides to 97.33-97.46 Gap Zone article details the current support test and its implications for markets seeking clarity on the next directional phase.
 Artem Voloskovets


