 Alex Dudov

⬤ The Dollar Index took a dive this week after buyers couldn't keep it above recent consolidation. The slide brought DXY right down to the 97.33–97.46 area—a zone tied to an earlier weekly gap. Price broke down hard from above 98.00, and once it lost the 97.92–98.02 level, selling picked up fast.
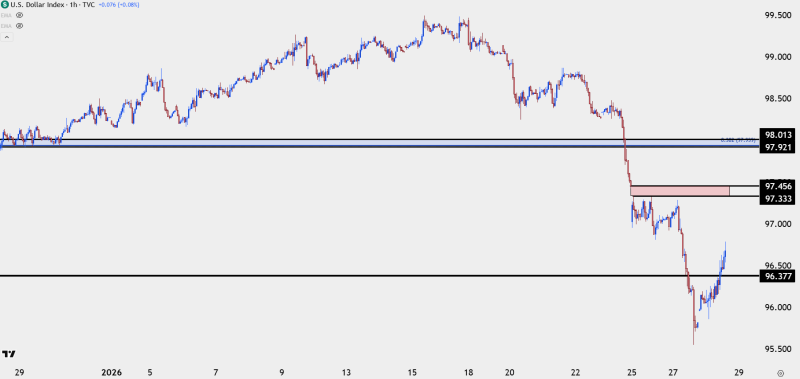
⬤ On the hourly, DXY sliced through what used to be support and pushed into the mid-96s before catching a small bounce. But even with that lift, price is still sitting below 97.33–97.46, which is now the line in the sand. This zone matters both technically and as a clue to whether the dollar's weakness is done or just getting started.
⬤ The chart makes it pretty clear where the boundaries are. The 97.33–97.46 range is what to watch right now, while 97.92–98.02 sits overhead as resistance if the dollar tries to recover. Until DXY gets back above that upper band, any rallies might just be dead-cat bounces rather than real reversals.
⬤ Why this matters: when the dollar moves, everything else feels it—FX pairs, commodities, risk assets, the works. How DXY handles this gap zone could set the tone for what comes next, especially if these technical levels keep doing their job.
 Alex Dudov


