Eseandre Mordi

A key signal is emerging in the bond market that has consistently preceded economic slowdowns. The chart shows the 3-month Treasury yield turning lower after a prolonged peak, while the 10Y-3M spread moves back into positive territory - marking a transition phase that has historically aligned with late-cycle dynamics.
The Shift That Comes After Inversion
The chart tracks the 3-month Treasury yield and the 10-year minus 3-month spread. The most important feature is the rollover in short-term rates after an extended period of elevated levels.
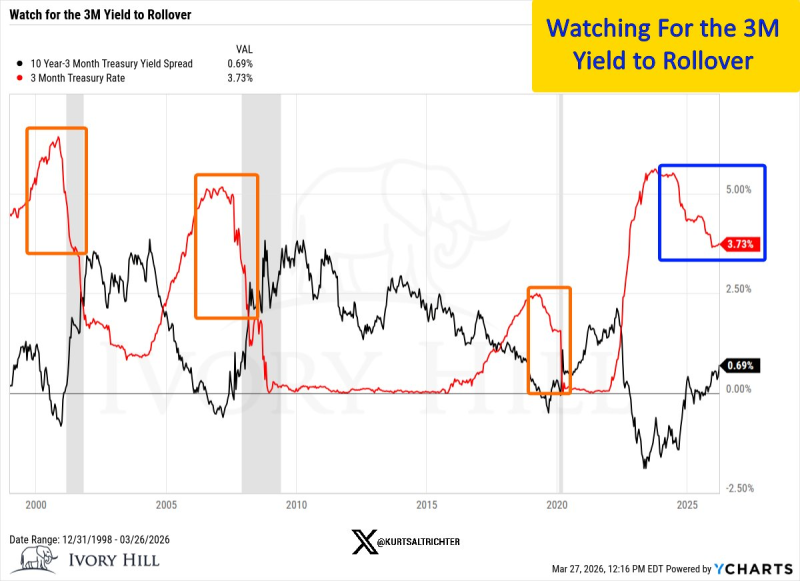
In previous cycles highlighted on the chart - early 2000s, 2006-2007, and 2019-2020 - the sequence followed a consistent structure: the curve inverts, short-term yields peak, and then begin to decline as the spread moves back toward positive territory.
The current setup reflects that same transition:
- The 3M yield has declined from above 5% to ~3.73%
- The 10Y-3M spread has moved back above zero to ~0.69%
- The inversion phase has ended, and early steepening has begun
This is not the beginning of a cycle - it is typically the late stage. US Recession Fears Are Finally Cooling Off: Risk Drops to Just 25% explored how sentiment has shifted even as structural signals like this one continue to develop.
Where the 3M Yield Curve Sends Its Strongest Signal
As Kurt S. Altrichter noted, the key signal is not inversion itself - it is the shift that follows.
Once short-term yields roll over and the spread turns positive, the system enters a bull-steepening phase. This occurs when short-term rates decline faster than long-term yields.
The key signal is not inversion itself, but the shift that follows - and that shift is now underway.
The highlighted zones on the chart reinforce this pattern. Each prior instance of a 3M yield rollover occurred shortly before periods of economic contraction, making this phase particularly important to monitor.
A Pattern Repeating With Consistency Across Cycles
The structure shown is cyclical and repeatable:
- Short-term yields rise into the end of tightening cycles
- The yield curve inverts as pressure builds
- Yields roll over and the curve steepens
- Economic conditions weaken with a lag
The current chart shows the first stages of this sequence unfolding again. However, the steepening is still relatively shallow, indicating that the process is not yet complete.
Gold (XAU) Price Reveals USD's Silent 8.4% Annual Decline reflects how this macro backdrop is already affecting asset pricing across markets, with dollar weakness compounding the late-cycle narrative.
The Signal Is Forming, Not Confirmed
The current setup remains in development rather than completion. Several elements are still unfolding:
- The 3M yield has started to decline but has not fully normalized
- The spread has turned positive but remains modest
- No full steepening cycle has occurred yet
This places the market in an early transition phase - historically the point where macro risk begins to rise rather than resolve.
This puts the market at an early transition point - historically the stage where macro risk starts building rather than easing. BTC, S&P 500, and Gold All Drop Below Key Levels in a Synchronized Risk-Off Sell-Off shows how that rising risk is already showing up across asset classes simultaneously.
From a structural perspective, the chart shows a system moving out of inversion and into steepening. While that may look like normalization on the surface, history suggests it often marks the beginning of a more challenging phase in the cycle.
 Eseandre Mordi