 Eseandre Mordi

The EUR/USD pair has pulled back into a key technical demand zone, drawing attention from Elliott Wave traders watching for a potential reversal. With price near 1.16 and a defined invalidation at 1.1505, the setup offers a clear risk framework heading into the next phase of price action.
Elliott Wave Blue Box: What the 1.16 Zone Means for EUR/USD
EUR/USD has dropped into what analysts label a "Blue Box" – a high-probability reaction zone derived from Elliott Wave methodology. The pair is currently trading near 1.16 after a sustained decline, and the corrective sequence appears to be approaching completion within a broader bullish structure. As long as price holds above the 1.1505 invalidation level, the bullish case remains technically intact. This zone was previously flagged in EUR/USD Price: Euro Tests Bullish Order Block Near 1.16 After Retracing From 1.20 Highs, where 1.16 was identified as a key demand region supporting upside continuation.
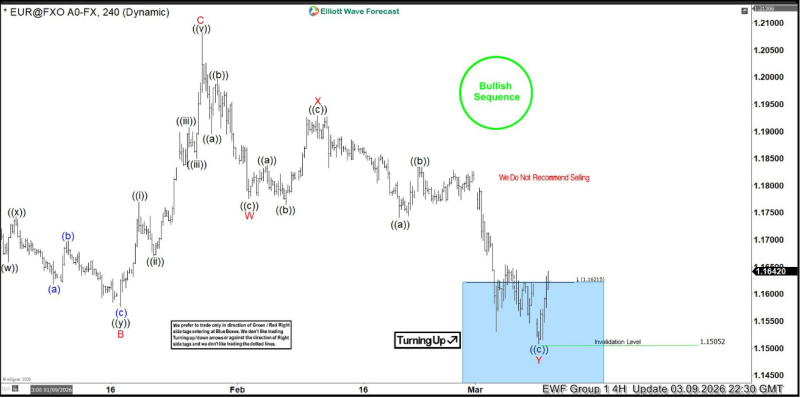
The current wave structure suggests the next move could be a three-wave recovery from this support zone. Elliott Wave patterns often resolve with a bounce before the next directional leg develops, and this setup fits that profile. Similar behavior was noted in EUR/USD Price Prediction: Targets Upside After Key Swing Low, where the pair consolidated inside a defined range before attempting a rebound toward higher resistance levels.
Macro Backdrop and Liquidity Zones Shaping EUR/USD Direction
Beyond the chart structure, EUR/USD continues to be shaped by macroeconomic factors including central bank policy divergence, inflation data, and shifting global risk appetite. Technical levels, however, remain central to short-term positioning. Liquidity zones and structural wave counts often determine near-term direction before macro drivers fully reprice. This dynamic was discussed in EUR/USD Forecast: Bearish Pressure Builds, where analysts showed how liquidity zones guided the pair's next move within a broader corrective context.
 Eseandre Mordi


