 Alex Dudov
⬤ XRP is now trading at a major horizontal support level on the weekly timeframe after sliding down from recent highs. Price has stabilized near the same zone that previously acted as a launching pad for strong rallies. The chart shows XRP holding just above this support area, with sellers unable to force a decisive break lower despite weeks of downward pressure.
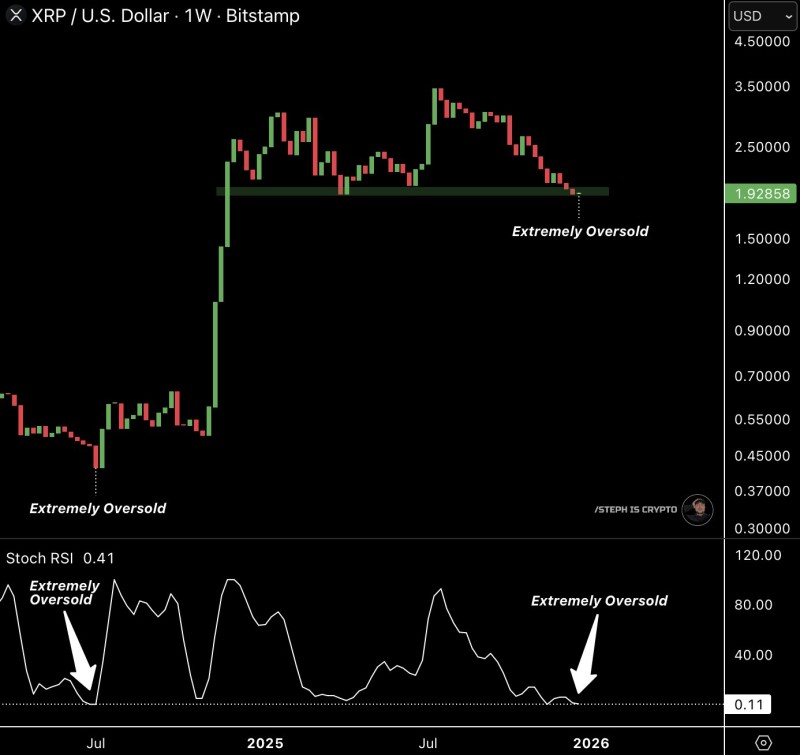
⬤ Momentum indicators back up what the price action is showing. The weekly Stochastic RSI sits at extreme oversold levels, with readings bottomed out near the indicator's floor. We've seen similar conditions at earlier points on the chart where downside momentum had already run its course before price started stabilizing. This tells us that most of the aggressive selling has already happened rather than building up steam.
⬤ The price structure itself suggests exhaustion rather than fresh weakness. XRP has given back a big chunk of its previous gains but keeps respecting that same horizontal support that marked earlier turning points. There's no sharp plunge lower, and the weekly candles are getting smaller—classic signs that bearish momentum is fading as sellers run out of gas.
⬤ Markets typically reverse when one side gets completely tapped out, and that's exactly the setup we're seeing here. XRP sitting at major weekly support with extreme oversold readings creates a critical inflection point. Whether it consolidates sideways or kicks off a new trend will likely set the tone for sentiment across other large-cap crypto assets in the coming weeks.
 Alex Dudov


