 Saad Ullah
⬤ XRP is still caught in a downtrend on the daily chart, but there's something interesting happening at support. The price keeps coming back to the same zone around $1.90, and each time it does, buyers step in rather than letting it crash through. This pattern shows that selling pressure isn't building the way you'd expect in a true breakdown scenario.
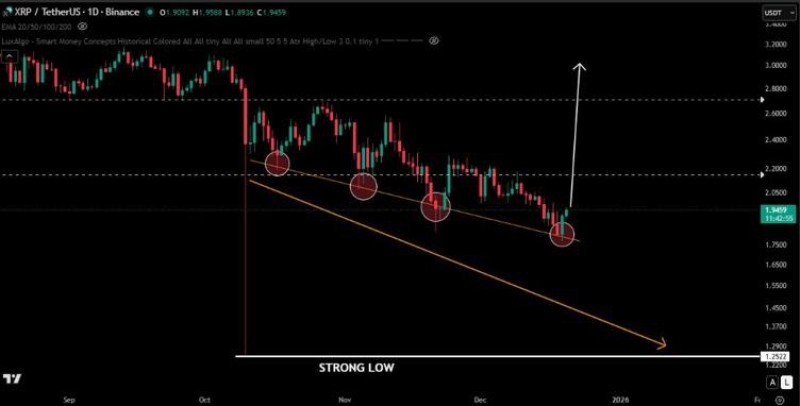
⬤ The chart reveals XRP moving lower under a descending trendline, but those support tests tell a different story. Each bounce off the "strong low" level shows demand meeting supply without any panic selling. We're not seeing those big red candles that usually signal accelerating downside momentum. Instead, buyers are quietly absorbing whatever sellers throw at them around the mid-$1.90s.
⬤ The levels to watch are straightforward. Getting back above $2.20 would be the first real sign that this downtrend might be losing its grip—that's where previous structure broke down. Beyond that, $2.60 represents the next meaningful resistance tied to earlier consolidation. Right now, price is compressed between support and that descending line, which usually means when it finally picks a direction, it'll move with conviction.
⬤ For the broader crypto market, XRP's behavior matters because it's one of those high-liquidity assets that tends to reflect overall sentiment shifts. When support gets tested this many times without breaking, volatility typically picks up afterward. How price handles this $1.90 floor and whether it can reclaim $2.20 could set the tone for near-term momentum across digital assets, especially if buyers keep defending this level within an otherwise bearish setup.
 Saad Ullah


