 Sergey Diakov

XRP is approaching a historically rare technical event, with price action pointing toward a seventh consecutive monthly loss. According to TheCryptoBasic, the asset has dropped sharply from its 2025 peak, with the ongoing streak echoing conditions last seen during the 2013-2014 cycle.
XRP Downtrend: From $3.60 Peak to Persistent Selling Pressure
The monthly chart tells a straightforward story. After reaching a peak near $3.60 in mid-2025, XRP entered a sustained downtrend marked by consecutive red candles.
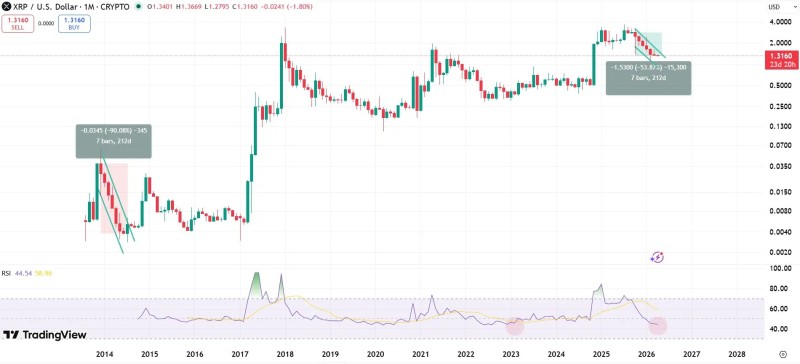
This sequence reflects consistent selling pressure rather than a single sharp drop - price has continued to print lower highs, with each recovery attempt failing to reclaim prior levels.
The structure remains firmly bearish, with no confirmed reversal pattern forming on the higher timeframe.
Recent analysis from XRP Price Analysis: Bearish Channel Threatens 40% Drop From Current Levels also highlights how XRP has remained under extended bearish pressure, reinforcing the broader downtrend structure.
XRP Has Lost Over 60% - Structural Weakness or Distribution Phase?
From the chart data, XRP has declined more than 60% from its peak and continues to extend losses into 2026. The move has been gradual but persistent, forming a staircase pattern lower across multiple months. This type of price behavior suggests ongoing distribution rather than capitulation - instead of a sharp bottom, the market is drifting downward in a controlled manner, with sellers maintaining dominance over time.
Price is now trading near the $1.30 region, aligning with areas where previous consolidation occurred. This zone is acting as a temporary stabilization point, but not yet a confirmed support reversal.
Sellers are maintaining dominance over time, and there is no evidence of absorption at current levels - just a slow, methodical grind lower.
XRP Momentum Hits Levels Not Seen Since the 2022 Collapse
The RSI on the monthly timeframe has dropped significantly, reaching levels not seen since the 2022 market collapse. Historically, similar conditions have appeared during extended drawdowns. Data referenced in XRP Price Analysis: Fear and Greed Cycles Driving Market Moves shows that extreme sentiment and weak momentum often coincide with major turning points - but only after structure stabilizes first.
The current setup closely mirrors the 2013-2014 cycle, where XRP also experienced a prolonged sequence of losses before transitioning into a recovery phase. A significant rebound followed that period, driven by extreme undervaluation conditions - though the chart itself shows no confirmed reversal yet.
Momentum is at its weakest point in years. Historical data suggests these levels have preceded major turning points - but only once structure confirms.
Broader technical setups - such as those discussed in XRP Price Analysis: Ripple Retests Breakout, Targets $27 - emphasize that long-term structure can remain intact even during extended pullbacks, provided key levels eventually hold.
For now, XRP remains in a sustained downtrend. The significance of the current moment lies not in a confirmed reversal, but in the rarity of the losing streak itself - placing the market at a point where historical comparisons begin to matter, even as price continues to search for stability.
 Sergey Diakov


