 Eseandre Mordi

⬤ XRP swung wildly this week. It dropped from $2.20 to $1.90 then climbed straight back to $2.20. The whole move took only a few sessions and left a sharp V on the chart. The fall began at the start of December - the rebound was just as steep.
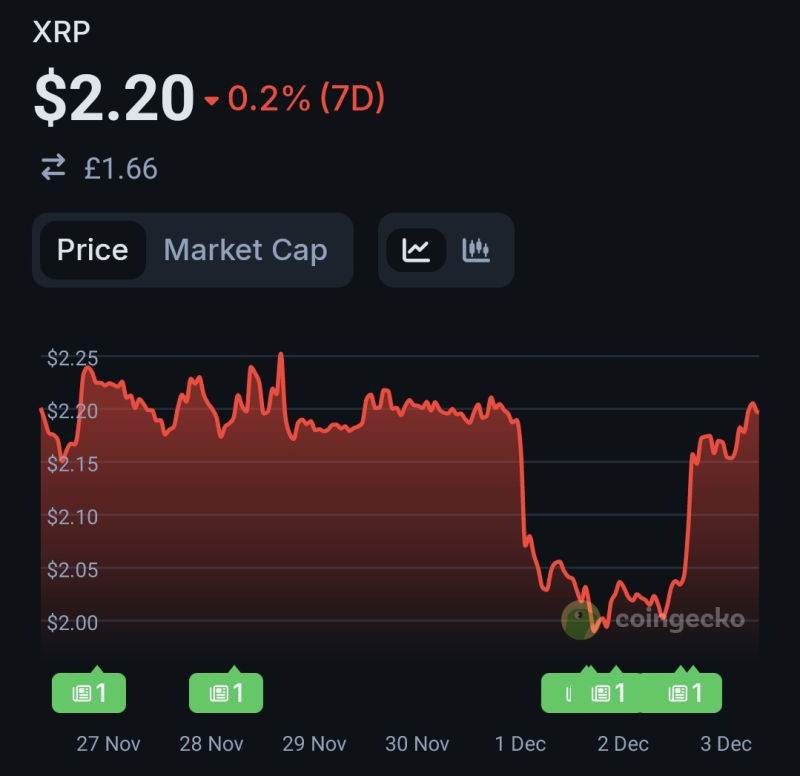
⬤ The chart shows XRP sitting near $2.20 until heavy selling drove it to about $1.90. The dip was brief. Buyers returned at once plus lifted price into the $2.15 - $2.20 range. After the intraday roller coaster the seven day result is almost flat - minus 0.2 percent, proof that the volatility was tightly contained.
⬤ The swift symmetry of the fall and rise shows how quickly XRP reacts when a few large trades hit the book. Moves of this kind scramble short term structure, shift liquidity pockets but also force traders to redraw support and resistance. The instant bounce also shows solid demand under $2.00, the area where buyers halted the slide.
⬤ The event underlines how fragile sentiment around XRP is right now. A sudden dislocation can flip direction without warning as well as reset traders’ view of momentum. With price back near $2.20, the market now watches whether that level holds or fresh turbulence appears.
 Eseandre Mordi


