 Peter Smith

⬤ XRP has developed a long-term symmetrical triangle pattern that's catching market attention, with fresh analysis suggesting this structure is part of a broader ABC corrective wave. Recent price action mirrors XRP's historical consolidation-to-breakout cycles, indicating the asset might be working through the final leg of Wave C before a larger trend reversal. The chart highlights both previous and current consolidation zones, along with past markup phases that emerged after similar breakouts.
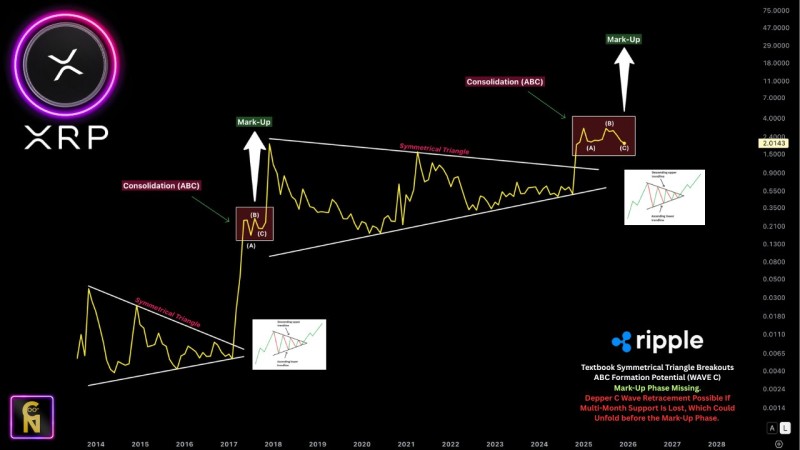
⬤ Historical data shows that following an extended consolidation between 2014 and 2016, XRP broke upward into a sharp markup phase before entering another symmetrical triangle that's unfolded over several years. The current pattern looks remarkably similar, with XRP trading within converging trendlines from 2018 through 2024. This long-term structure aligns with the classic contraction phase typically observed before major price movements. The ABC wave labeling suggests the token may still be finishing Wave C, with price hovering near the long-term lower trendline.
⬤ The chart presents two scenarios: a breakdown could extend the corrective structure before any significant upside develops, while maintaining current support might set the stage for a new long-term markup phase similar to the breakout after the previous multi-year triangle. Whether XRP transitions into a fresh expansion phase or experiences further retracement, the symmetry between historical and current patterns is likely to influence sentiment and trading behavior across the XRP ecosystem as market participants closely watch support stability.
 Peter Smith


