Usman Salis
XRP has been showing some weakness lately, and traders are keeping a close eye on whether it might drop back down to $2.
What the Chart Shows
Crypto analyst Ali recently pointed out this possibility on Twitter, sharing a chart that shows the token's current price structure and what might happen next.
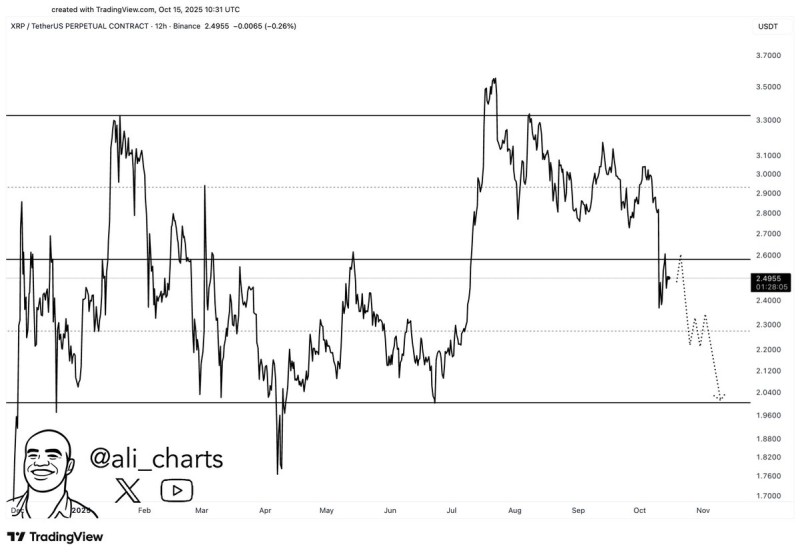
Looking at the XRP/USDT chart on Binance's 12-hour timeframe, there's a resistance zone between $2.65 and $2.70 where XRP tried to push through but got rejected. That rejection kicked off a downtrend that's now pointing toward a potential test of the $2 support level. There's also a middle zone around $2.30 to $2.40 where the price might pause briefly before any deeper move lower.
The Bigger Picture
XRP hasn't been able to hold onto its gains after failing to break above $3.30 earlier this year. The broader crypto market hasn't helped either—Bitcoin's been moving sideways, which tends to keep altcoins like XRP in check. The fact that XRP couldn't stay above $2.60 is a warning sign, especially for anyone trading with leverage.
That said, long-term believers in XRP aren't shaken. They're still bullish on its real-world use in cross-border payments. So while the technicals suggest a dip to $2 might be coming, a sudden shift in market mood could flip the script pretty quickly.
 Usman Salis