 Usman Salis

A notable imbalance is emerging in XRP markets right now. Corporate accumulation keeps climbing while the price itself moves in the opposite direction - and traders are paying close attention. The chart shared by DrBullZeus shows a steady rise in corporate treasury commitments alongside a declining XRP price into early 2026, an unusual divergence that is growing harder to ignore.
XRP Falls From $3.65 Peak to Lower Highs
XRP's price structure reflects a clear shift in momentum following its mid-2025 peak. After rallying sharply to an all-time high near $3.65, the asset entered a corrective phase marked by consistent lower highs and declining momentum.
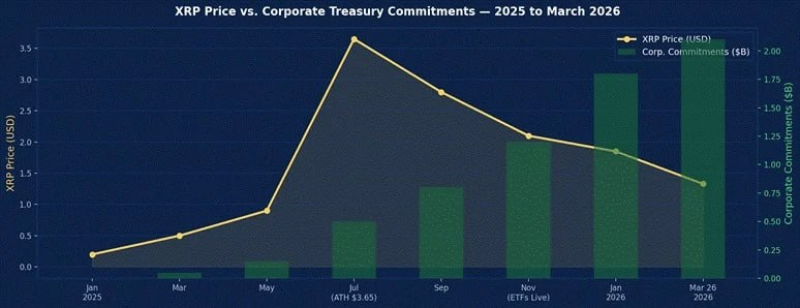
The progression is technically clean - each rebound fails below the previous peak, forming a descending structure. Price has moved from the $3.60+ zone down toward roughly $1.30-$1.40 by March 2026, reinforcing a bearish trend.
The breakdown below the $2.00 region stands out as a key turning point, shifting market behavior from expansion to contraction.
This type of structure typically signals weakening buyer control, especially when prior support zones fail to hold.
XRP Corporate Buying Crosses $2 Billion as Price Keeps Falling
While price trends lower, corporate treasury commitments show the opposite behavior. The chart illustrates a steady increase from near zero in early 2025 to above $2 billion by early 2026.
This creates a rare divergence:
- XRP price peaked mid-2025 and continues to decline
- Corporate allocations rise consistently throughout the same period
- No immediate bullish response in price despite growing exposure
This pattern resembles accumulation without confirmation - where demand builds in the background but fails to trigger upward price movement.
Similar dynamics have been observed in other XRP setups, where rising activity or adoption does not immediately impact price. XRP Price Analysis: Velocity Jumps to 0.0324 notes increasing network activity alongside stable pricing, highlighting how adoption can lag behind price action.
XRP Structure Remains Under Pressure
Technically, XRP continues to print lower highs and lower lows, keeping the broader trend intact. The key structural zones visible on the chart include:
- The $2.00 area acting as a former support turned resistance
- The current $1.30-$1.40 range serving as a fragile support zone
- A continued downward slope from peak levels
There are no visible signs of reversal in the structure itself - no higher highs or strong reclaim of resistance zones. Until that changes, the trend remains controlled by sellers.
Longer-term perspectives still point to potential upside scenarios if structure shifts. XRP Price Prediction: 3 Scenarios Range from $5 to $100+ outlines how future price expansion could depend on broader adoption milestones. Meanwhile, XRP Price Analysis: Ripple Eyes $5-$16 Range highlights how long-term accumulation structures can eventually lead to higher valuation ranges.
The Setup Heading Into the Next Cycle
The current XRP setup is defined by tension between two opposing forces - declining price structure and steadily increasing corporate participation.
Without a structural shift - such as reclaiming key resistance or forming higher highs - the trend remains technically weak. However, the persistence of accumulation introduces the possibility that the market is still absorbing supply beneath the surface.
Whether this divergence resolves through a delayed upside move or continued downside pressure will likely define XRP's trajectory in the next cycle.
 Usman Salis


