Saad Ullah

⬤ XRP is displaying a recurring market structure centered on a single exponential moving average on the weekly timeframe. The highlighted level is not a simple moving average but an EMA that appears repeatedly across historical cycles and the current formation.
⬤ The long-term chart marks multiple moments where price interacts with the same dynamic level while respecting a broader rising macro trendline. The pattern is presented as a repeating structural reference point rather than an isolated occurrence.
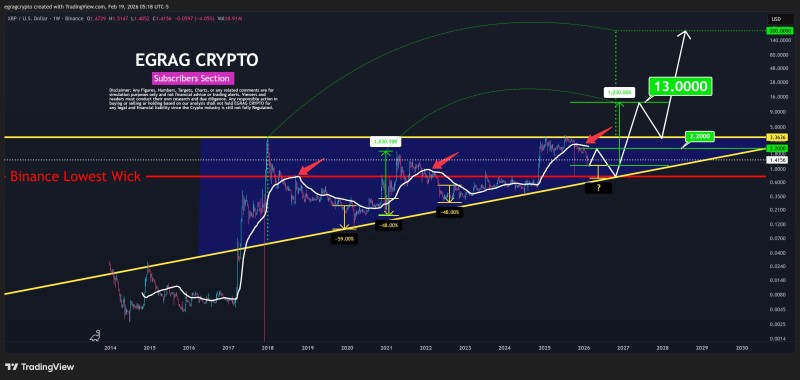
⬤ The current positioning places XRP once again around that EMA area, aligning the ongoing structure with previous formations shown on the chart. As the analyst notes, "This EMA has acted as a critical pivot point across multiple cycles, and we're seeing that same interaction play out again."
⬤ Similar behavior was discussed in XRP Price Analysis: Historical Patterns Signal Potential Rally where historical structures were also highlighted as repeating across cycles. Comparable cycle alignment appeared in XRP Price Analysis: Technical Signals Point to $4 where technical indicators acted as key reference levels for broader movement.
⬤ The recurrence of this EMA interaction highlights a consistent technical reference within the broader XRP cycle. The chart suggests the market is again approaching a level that previously coincided with important structural phases. This pattern recognition could provide traders with historical context for understanding current price action and potential future movement based on how XRP behaved at similar junctures in past cycles.
 Saad Ullah