 Saad Ullah

As EGRAG CRYPTO noted, the structure is framed not as bearish weakness but as pressure building before expansion. In that setup, $1.80 is the line that determines whether XRP needs one more shakeout first or is ready to move immediately.
The Atlas Line Keeps XRP's Bigger Structure Intact
The chart centers on the rising Atlas Line, which continues to act as the main long-term support. XRP remains above that trendline while price is simultaneously being squeezed under a descending resistance marked as Line 3.
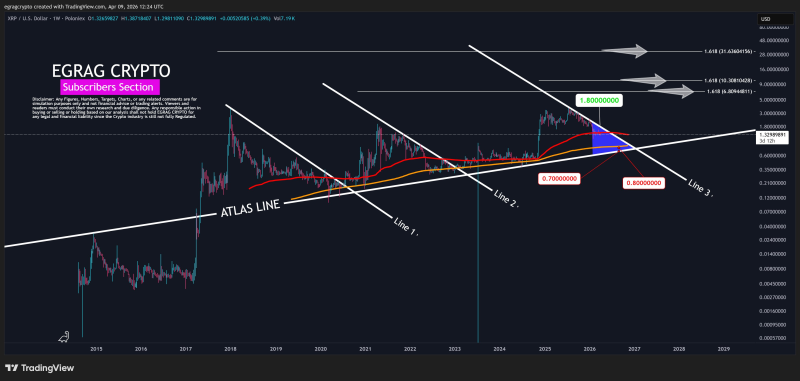
That leaves the market in a tightening formation. Instead of showing a broken trend, the chart presents a structure where support is rising and resistance is pressing down - creating the kind of compression that often precedes a larger directional move.
Why $1.80 Matters More Than Any Other XRP Level
The tweet identifies $1.80 as the invalidation level - and that makes it the most important trigger on the chart. If XRP breaks and holds above $1.80, the orange probability zone around $0.70-$0.80 is likely skipped and expansion begins immediately. If price rejects that level instead, the chart favors a lower sweep before the larger move unfolds.
That framing turns $1.80 into more than resistance. It becomes the dividing line between immediate continuation and one final reset.
Elliott Wave Chart Hints at One Final Dip Before a Breakout explored the structural logic behind the lower sweep scenario well ahead of the current setup, showing how the fake-breakdown-then-expansion pattern has appeared in XRP's prior cycle behavior.
The Final XRP Shakeout Scenario Still Has Higher Odds
The chart assigns a 60-70% probability to a move into the orange zone between $0.70 and $0.80. The logic is straightforward: liquidity sits below, the compression structure may still need a final sweep, and XRP has shown similar behavior before. In that reading, a move lower would not invalidate the bullish macro setup - it would complete it.
XRP Price Prediction: Ripple Could Rally Toward $8.6 by Late 2026 After Testing $1 Support outlines what the recovery path looks like from lower support levels - reinforcing the idea that even the bearish short-term scenario keeps the longer-term expansion thesis intact.
Fibonacci Targets Keep the XRP Expansion Thesis Alive
The chart highlights three Fibonacci targets drawn from different structural layers: approximately $6.80, $10.30, and $31.60. These are presented as harmonic targets from the macro cycle, the mid-cycle structure, and the local breakout leg - not random projections, but part of a broader expansion map once the current compression resolves.
XRP Price Prediction: Chart Points to $27 Target provides supporting analysis for the upper end of that range, showing how the $27-$31 zone has been appearing consistently across multiple independent technical frameworks applied to XRP's long-term structure.
 Saad Ullah


