 Saad Ullah

● In a recent technical analysis post, ChartNerd laid out a bullish long-term case for XRP, arguing that the cryptocurrency is gearing up for a new impulse wave similar to what we saw back in 2017. The core of the analysis revolves around a symmetrical triangle pattern on XRP's multi-year chart—a classic consolidation setup that typically shows up before major price moves. According to the chart, XRP has once again pushed above its descending resistance line, mirroring the 2017 pattern that led to a parabolic rally.
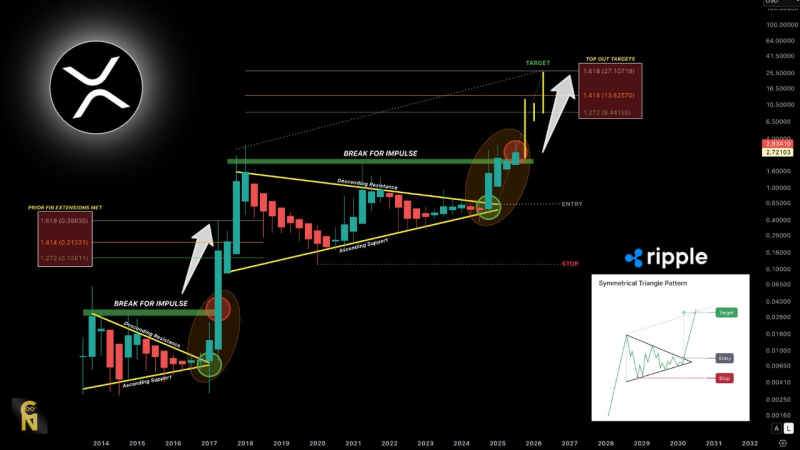
● The chart maps out three key Fibonacci extension targets based on historical price action: the 1.272 level at $8.44–$8.00, the 1.414 level at $13.62–$13.00, and the 1.618 level at $27.10–$27.00. If things play out as expected, these Fibonacci zones could serve as major resistance areas—with the highest target around $27, which would mean a substantial rally from the current price near $2.80. The breakout, marked as "Break for Impulse" on the chart, points to a shift in sentiment as XRP keeps consolidating above what used to be resistance and has now flipped to support.
● Technical indicators like Heikin-Ashi candles back up the bullish picture, showing sustained momentum instead of just short-term noise. As ChartNerd put it, "You can't stop the trajectory to double-digits," pointing to XRP's earlier run where it hit all the Fibonacci targets during the 2017 cycle.
● Of course, no chart can guarantee what's coming next, but the technical setup does suggest strong upside potential for XRP—assuming macro conditions stay favorable and the broader crypto market keeps recovering. Traders and analysts are watching closely to see if this second symmetrical triangle breakout will deliver the same explosive move we witnessed eight years ago—possibly kicking off a new chapter in XRP's long-term price journey.
 Saad Ullah


