 Marina Lyubimova
⬤ XRP is sitting in a holding pattern right now, hovering around $1.87 on Binance as traders work through what the liquidity maps are telling them. The current setup shows pretty clear pockets where most of the trading volume has been piling up lately. These aren't random spots—they're the areas where XRP keeps bouncing back to, creating what looks like a roadmap of where the real action is happening.
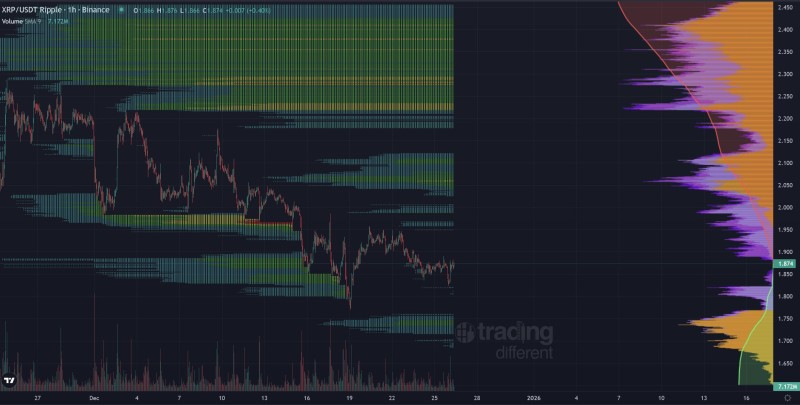
⬤ The charts show these high-traffic zones stacked above and below where XRP is trading now, with the biggest clusters sitting higher up. Recently, XRP has been ping-ponging around these same levels without making any dramatic moves, especially compared to the wild swings we saw earlier in December. The volume profile makes it pretty obvious where traders have been most active—you can see the spikes at specific price tiers where people have been putting their money to work.
⬤ What makes this interesting is how liquidity tends to pull price action toward it over time. Traders often flock to areas where there's already heavy participation, and XRP seems to be following that pattern. Nobody knows exactly how it'll play out, but watching how XRP reacts when it hits these major liquidity pockets could tell us a lot about where sentiment is headed as we move closer to 2026.
⬤ XRP remains one of the most-watched tokens out there, and this kind of liquidity-based reading gives traders a sense of where meaningful buying or selling pressure might show up next. As the token continues working through these defined zones, how it handles the biggest concentration areas could shape the broader mood around XRP heading into next year.
 Marina Lyubimova


