 Alex Dudov
XRP is trading at a critical juncture after an extended pullback, with price now sitting near a key support level while the broader structure suggests the correction may be part of a larger bullish cycle. Analyst TheCryptoBasic notes that the current decline - down over 27% in 2026 - fits within a corrective framework rather than signaling a structural breakdown. The setup reflects a market in retracement rather than confirmed reversal, keeping attention on both downside risk and long-term upside projections.
XRP Wave 2 Correction Pulls Price Toward $1.21
The chart outlines a completed impulsive move followed by a structured decline, labeled as a Wave 2 correction.
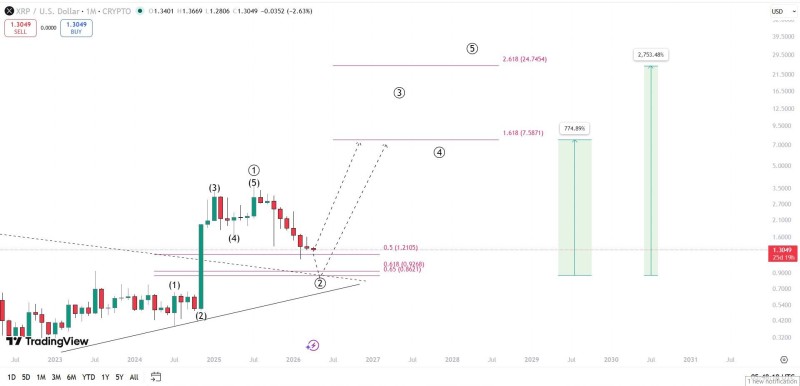
Price has retraced from its highs and is now testing the $1.21 level, which aligns with the 0.5 Fibonacci retracement.
The current decline fits within a corrective framework rather than signaling a structural breakdown
This pullback is consistent with broader XRP behavior in recent cycles, where sharp advances are followed by deep corrections before continuation. Similar XRP Price Prediction: Elliott Wave Shows Final Dip Before Rally technical interpretations suggest that such retracements often fall within the 50% - 61.8% range before the next expansion phase begins.
XRP Support Zones Between $0.62 and $1.21
The chart clearly identifies layered support levels that define the current downside structure. Price is holding near $1.21, while a deeper zone is marked between $0.92 and $0.86.
These levels correspond to key Fibonacci retracement areas and represent zones where buyers could potentially step in. A more extreme downside scenario is also outlined near $0.62, marking the lower boundary of the broader corrective range.
Multi-level support reinforces that the market remains in retracement, with risk distributed across defined zones
This multi-level support structure reinforces the idea that the market is still in a retracement phase, with risk distributed across defined zones rather than concentrated at a single level. For additional context, XRP Could Soar Toward $18 After $3.33 Breakout analysis has previously outlined how holding these structural levels has historically preceded significant rallies.
XRP Wave 3 Targets: $7.58, $24.75 and $37
Beyond the current correction, the chart projects a potential Wave 3 expansion. In Elliott Wave theory, Wave 3 is typically the strongest and most extended move, often driving the largest gains in a cycle.
Wave 3 phases are expected to deliver the most aggressive upside, often surpassing prior highs by a wide margin
Projected targets on the chart include:
- Around $7.58 at the 1.618 extension
- Approximately $24.75 at the 2.618 extension
- A possible extended move toward $37
These projections align with broader XRP Price Prediction: Wave 3 Maps $15 - $31 Targets analyses where Wave 3 phases are expected to deliver the most aggressive upside, often surpassing prior highs by a wide margin.
XRP Sits Between Decline and Expansion
Despite the bullish projections, XRP remains in a corrective structure. Price has not yet confirmed a reversal, and the current phase is still defined by retracement rather than expansion.
The setup reflects a balance between defined downside levels and significant upside potential. XRP is not yet signaling a new trend - it is completing a phase within a larger structure. The next decisive move will depend on how price reacts at support, but the chart makes one thing clear: the correction is only part of the story, not the full narrative.
 Alex Dudov


