 Marina Lyubimova
XRP has struggled to find direction after a sharp decline pushed prices toward the $1.20 area earlier this year. Since that drop, the cryptocurrency has been grinding sideways in a narrow range, unable to attract the buying interest needed to stage a meaningful recovery. For traders watching the daily chart, the message is clear: sellers are still in control.
XRP Daily Chart Shows "Flat of Demand" at $1.38
XRP is showing signs of weakening demand on the daily timeframe. The chart currently appears "flat of demand," with XRP Stabilizes Near $1.35, Eyes $1.50 Recovery noting how supply pressure has consistently capped rallies. Repeated upper shadows across recent candles confirm that buyers remain hesitant to hold positions at higher levels.
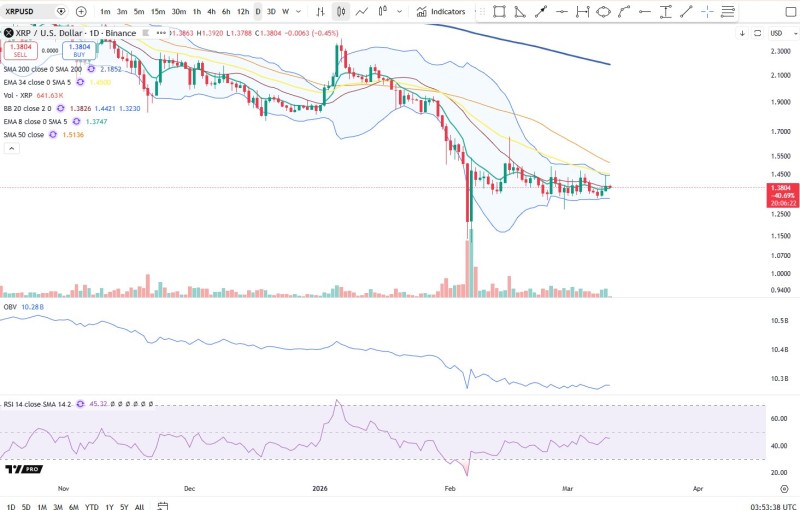
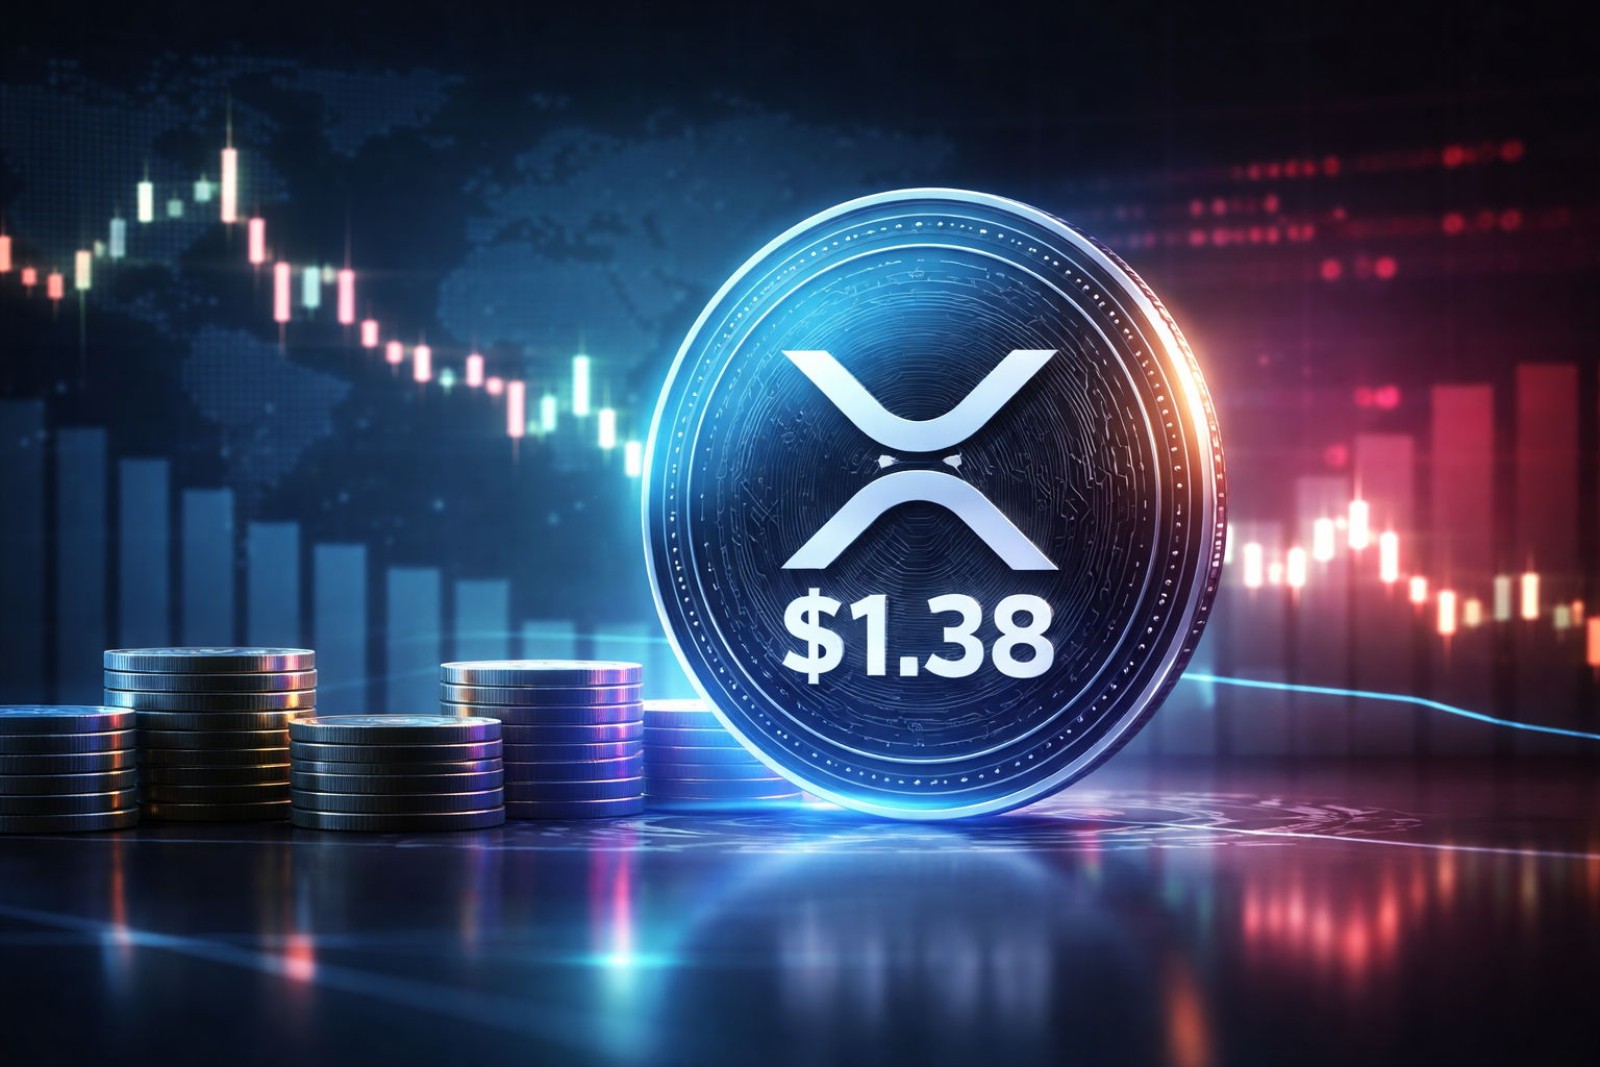
After bouncing from the $1.20 area, XRPUSD has entered a sideways consolidation phase near $1.38.
The XRP daily chart currently appears flat of demand, with upper candle shadows suggesting selling pressure continues to emerge whenever the market attempts to rally.
Green candles appear during brief rebounds, but the upper wicks on multiple sessions indicate that rallies are consistently met with selling. The pattern reflects a market that has yet to find a convincing reason to move higher.
On-Balance Volume and RSI Signal Neutral Momentum
Technical indicators reinforce the bearish lean. On-balance volume continues trending lower, suggesting that buying activity remains limited compared to previous periods. The Relative Strength Index is hovering near the mid-range, signaling neutral momentum rather than a bullish recovery. Analysis covered in XRP Price Analysis: Bearish Channel Threatens 40% Drop From Current Levels highlights how the same supply dynamics have been weighing on price for several sessions.
The repeated formation of upper shadows reinforces the idea that sellers dominate whenever XRP attempts to push higher. Consolidation with weak demand often signals that price could drift lower until stronger buying interest appears. As examined in XRP Eyes $1.43 Break After Bouncing Off $1.33 Fibonacci Support, the $1.33 Fibonacci level and $1.43 resistance remain the key levels that will determine the next directional move. Until buyers step in with conviction, the sideways grind near $1.38 is likely to continue
 Marina Lyubimova


