 Usman Salis

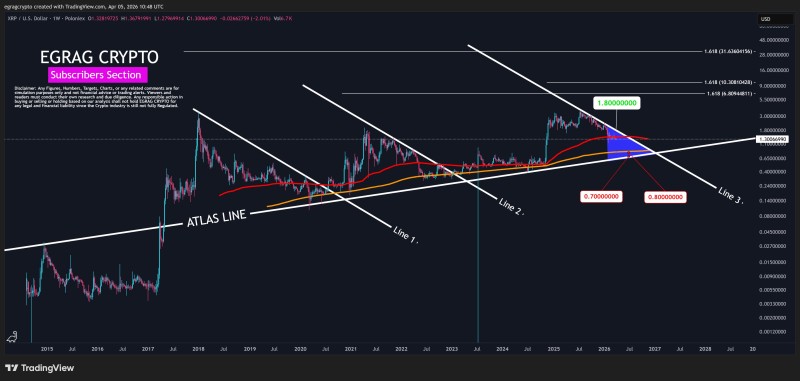
XRP's long-term structure is entering a pivotal phase, where multiple support layers are being tested simultaneously. Analyst EGRAG CRYPTO outlined how the interaction between the red and orange lines defines the key "battle zones," with both acting as critical reference points for the current setup. The chart shows a clear battle between rising structural support and descending resistance, with momentum compressing into a decisive point.
A Framework Built on Two Core XRP Support Lines
The chart emphasizes two primary support zones: the orange line and the ATLAS Line. These are not arbitrary levels - they are structural components that define XRP's long-term support framework.
Price is currently sitting directly on top of this confluence. Historically, XRP has respected rising support structures during extended consolidations, and the current alignment suggests that this area is once again acting as a base.
The orange and ATLAS Lines are not just reference points - they are the foundation the entire structure rests on. As long as they hold, the macro picture stays intact.
At the same time, price is holding above the broader ascending trajectory, reinforcing the idea that the macro structure remains intact as long as these zones are preserved.
XRP Compression Signals a Decisive Move Ahead
The most striking feature of the chart is the tightening formation. XRP is compressing between:
- A descending resistance line (red zone)
- A rising support base formed by the orange line and ATLAS Line
This creates a triangular structure where volatility contracts over time. Similar setups have been observed across recent market analysis, where tightening ranges tend to precede sharp directional moves, especially as price approaches the apex.
When price compresses into a triangular structure like this, resolution rarely comes gradually. The tighter the range, the more decisive the breakout tends to be.
Recent price action shows rejection near the upper boundary, followed by a pullback into support. This shift reflects a loss of upward momentum, while still maintaining structural integrity on the downside.
Fibonacci Targets Reflect Multiple XRP Structural Scenarios
The chart outlines multiple Fibonacci extension targets at the 1.618 level, with projected ranges extending from approximately $7 to $10 and potentially higher toward $31.
These targets are not immediate price objectives but represent different structural scenarios depending on how the pattern resolves. Similar long-term projections based on Fibonacci extensions have been highlighted in broader XRP cycle analysis, where extended targets depend heavily on support holding and trend continuation.
The presence of multiple 1.618 levels reflects varying interpretations of the structure rather than a single linear forecast.
Multiple 1.618 extensions pointing to the $7-$31 range are not contradictions - they represent different structural reads of the same setup, each valid depending on which base the move originates from.
The Zone Where XRP Structure Either Holds or Fails
The chart clearly marks downside zones around $0.70 - $0.80, positioned below the current support cluster. These levels represent potential reaction areas if the orange line and ATLAS Line fail to hold.
At the same time, the upper boundary remains capped by descending resistance, limiting bullish expansion until a breakout occurs.
This leaves XRP at a technical inflection point:
- Holding support preserves the broader structure
- Losing it shifts price toward lower support zones around $0.70 - $0.80
- Breaking resistance reopens the path toward higher Fibonacci projections
The market is no longer trending cleanly - it is compressing. And in structures like this, resolution tends to be decisive rather than gradual.
 Usman Salis


