 Eseandre Mordi
⬤ A new long-term XRP chart is making the rounds, showing what looks like a "staircase" pattern—long stretches of sideways movement followed by sharp rallies, then more consolidation. Right now, XRP is sitting in what's called a "Vertical Accumulation" zone, trading near the bottom of that range around $2. The chart marks this area as "Vertical Accumulation Support," with resistance up toward the top of the band.
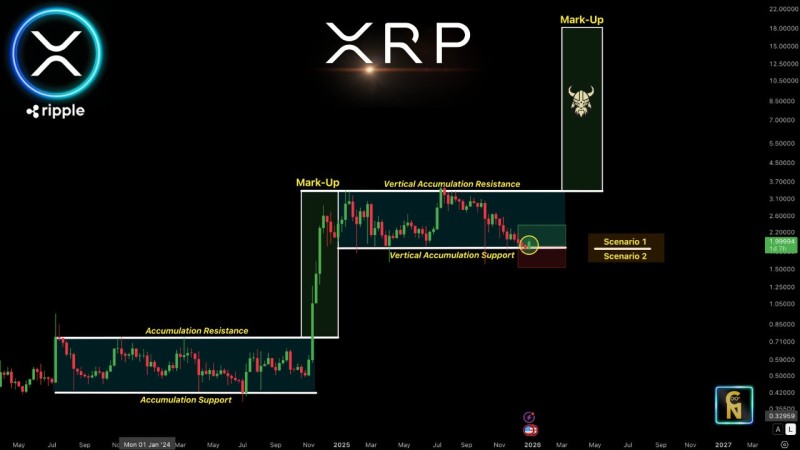
⬤ The pattern mirrors an earlier phase where XRP churned sideways for months before launching into a strong "Mark-Up" move. That breakout eventually led into the current vertical accumulation channel, which stretches from 2025 into early 2026. The chart shows XRP pulling back from recent highs and now testing support where it's currently consolidating.
⬤ Two scenarios are mapped out going forward. Scenario 1 has XRP holding support in the lower part of the accumulation zone before pushing higher. Scenario 2 shows a brief dip below support into a lower band, followed by a bounce back into the structure. Above the consolidation zone, there's a large projection block labeled "Mark-Up" pointing significantly higher, though no specific price target is given beyond the structural framework.
⬤ Traders pay close attention to these long-term structural patterns, especially for assets like XRP that have a history of extended quiet periods followed by explosive moves. With XRP now sitting near vertical accumulation support around $2, the market is watching to see if it holds the current range or takes the alternate path before any potential breakout unfolds.
 Eseandre Mordi


