Saad Ullah

Stellar is approaching a critical decision point on the charts. The XLM/USDT pair is forming an ascending triangle on the 4-hour timeframe, with price squeezing between rising support and a flat resistance band sitting near $0.18-$0.19. Analyst Nehal flagged the setup on the 4H timeframe, noting the breakout level is cleanly defined and the structure is holding well.
XLM Pattern Defined by Rising Support and Flat Resistance
The chart clearly shows an ascending triangle, where higher lows are continuously pushing price upward into a horizontal ceiling. That dynamic reflects growing buying pressure - each dip is being picked up more aggressively than the last, while the upper boundary keeps capping any attempt at a clean breakout.
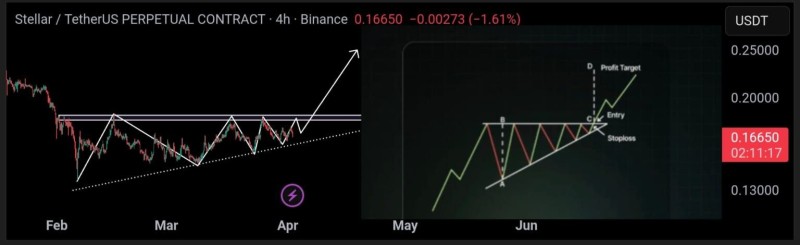
The pattern is forming cleanly on the 4H timeframe, with the breakout level defined at $0.18-$0.19.
This compression effect is a hallmark of ascending triangles - the longer price stays coiled beneath resistance, the more energy builds for the eventual move. The structure is not yet resolved, but the shape of the pattern makes the direction of that resolution pretty clear.
Why the $0.18-$0.19 Zone Is Critical for XLM
The resistance band between $0.18 and $0.19 has already been tested multiple times without a clean close above it. Each rejection reinforces just how significant this level is - but repeated tests also tend to wear resistance down. Markets rarely hold forever against sustained pressure, and XLM is starting to feel that weight at the top.
A confirmed close above $0.18-$0.19 is the key trigger - without that, the structure remains in consolidation.
Similar technical setups have historically led to sharp upside continuation once resistance is cleared, especially after extended compression phases where price has been grinding tighter for an extended period.
XLM Structure Points to Potential Price Expansion
The chart projection shows a continuation move following a confirmed breakout, consistent with how ascending triangles typically resolve. Several elements support that scenario:
- Rising trendline holding higher lows
- Flat resistance repeatedly tested from below
- Price consolidating near the upper boundary of the range
Together, these elements reflect building pressure within the structure - the kind that tends to release quickly once a catalyst arrives or resistance finally gives way.
Price is consolidating near the upper boundary, and that combination reflects building pressure inside the structure.
Confirmation Remains the Only Trigger
The setup is conditional - and that matters. Until XLM closes above the $0.18-$0.19 band on the 4-hour chart, the pattern remains unresolved. Price could continue grinding sideways, or even pull back toward trendline support, before making another attempt at the breakout level.
XLM now sits at a technical inflection point where structure favors a breakout, but the market still needs to confirm. A clean close above resistance is what turns this setup from a pattern into a trade.
 Saad Ullah