 Saad Ullah

Stellar (XLM) is gaining momentum after weeks of sideways trading. The cryptocurrency has successfully broken out of a falling wedge formation on the 8-hour timeframe, which is typically considered a bullish reversal signal. This technical development, combined with price action above the 100-period moving average, suggests that buyers are regaining control.
XLM Technical Breakout in Motion
Analyst Jonathan Carter highlights that XLM's recent breakout represents a meaningful shift in market structure.
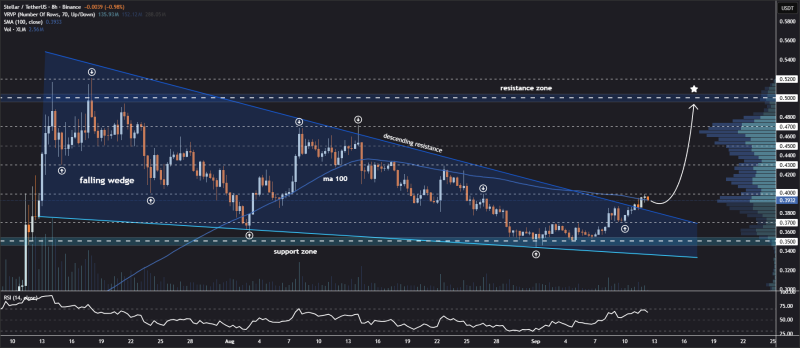
The token has successfully reclaimed the $0.39–$0.40 area, effectively transforming what was previously resistance into new support. This breakout from the falling wedge pattern suggests that the recent bearish trend has ended, and XLM appears to be establishing a new bullish trajectory.
Chart Analysis: Key Levels to Watch
XLM is currently trading around $0.3932, having cleared both the descending trendline resistance and the 100-period moving average. The immediate resistance levels to monitor are $0.43 and $0.45, with extended targets at $0.47 and $0.50. On the downside, the $0.35 area remains the critical support zone. The RSI indicator is currently rising and has room for additional upward movement.
Why XLM Could Climb Higher
Several technical factors support higher prices. Falling wedge breakouts historically produce strong rallies, especially after extended consolidation periods. Trading above the 100-period moving average strengthens the bullish case. Volume patterns also appear supportive, with increasing buying interest above the $0.39 level, suggesting growing optimism about XLM's prospects.
 Saad Ullah


