Peter Smith

Stellar is flashing a pattern that longtime chart watchers will recognize. On the weekly timeframe, XLM is holding a rising trendline after two clear touches and then compressing directly above support - a sequence that, as CW pointed out, mirrors the behavior that preceded a strong rally in the previous cycle.
The setup is not a noisy breakout attempt. It is quiet, almost deliberate - price holding its ground rather than surging or collapsing. And in technical analysis, that kind of stillness near a key level often carries more weight than dramatic candles in either direction.
XLM chart echoes 2017 with 2 trendline touches and tight base
The long-term chart shows a well-defined ascending channel, with price respecting the lower boundary in a consistent pattern.
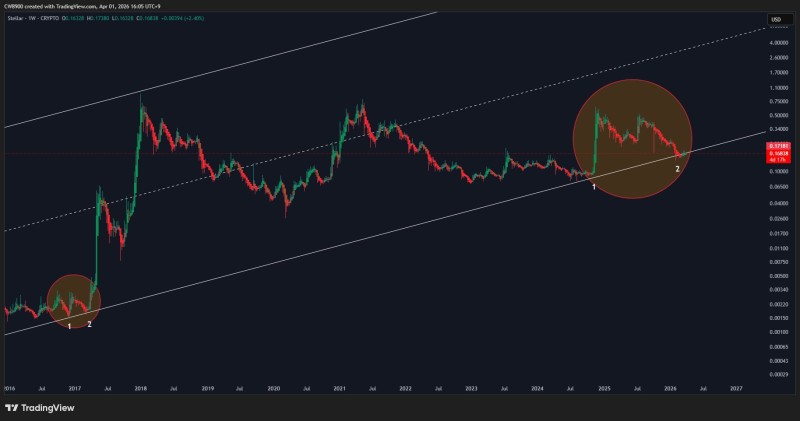
Two distinct support touches stand out clearly - after which XLM did not bounce aggressively but instead moved sideways directly above the trendline.
The structure mirrors the previous cycle, where similar behavior at the base preceded a strong upside move.
This kind of stabilization at channel support, combined with controlled candle formations, is the textbook definition of a base build. Historically, assets that pause here without breaking down tend to resolve that pause with force - one direction or the other, though the bias leans toward continuation when the broader structure is intact.
Compression at $0.16-$0.17 signals a coil, not weakness
The defining feature of the current XLM setup is compression. Price is moving sideways along the ascending trendline in the $0.16-$0.17 region while volatility contracts - a sign that sellers are not pressing and buyers are not rushing either.
There is no visible breakdown below support. Candles remain relatively stable, with no signs of panic selling. According to recent analysis pointing to a $0.60 rally target, XLM's tendency to build structure near support before attempting a breakout is a recurring pattern across multiple timeframes.
Price is effectively coiling near a critical level. In technical analysis, such compression often leads to a strong directional move once resolved.
The tightening range reflects accumulation behavior rather than indecision. When volatility contracts against a well-tested support level, the market is essentially deciding - and that decision, once made, tends to be decisive.
The 3-part XLM sequence traders are comparing to 2017
The 2017 comparison is built on a specific sequence, not just a general feeling of similarity. The pattern consists of:
- Two clear touches of the lower ascending trendline
- Sideways consolidation directly at support without breakdown
- Stability in price structure rather than escalating selling pressure
- Formation of a recognizable base ahead of potential expansion
Similar setups in past cycles have led to large impulsive moves once overhead resistance was cleared. As seen in XLM's $0.47 breakout analysis, the coin has repeatedly demonstrated a tendency to build structure before making its move rather than reacting impulsively to market-wide momentum.
Ascending support holds as XLM pressure builds near the trendline
XLM currently sits in a technically sensitive position. Holding the ascending support keeps the entire structure intact, and continued compression increases the likelihood that the next move - when it comes - will emerge from this base rather than from a higher re-entry point.
The chart does not yet confirm direction. But the pattern remains consistent with a buildup phase, and for those tracking XLM's Elliott Wave setup targeting $3.4, this compression at a key trendline adds structural weight to the longer-term thesis. The setup is in place. What happens next at the $0.16-$0.17 support level will determine whether the 2017 parallel plays out again.
 Peter Smith