 Artem Voloskovets
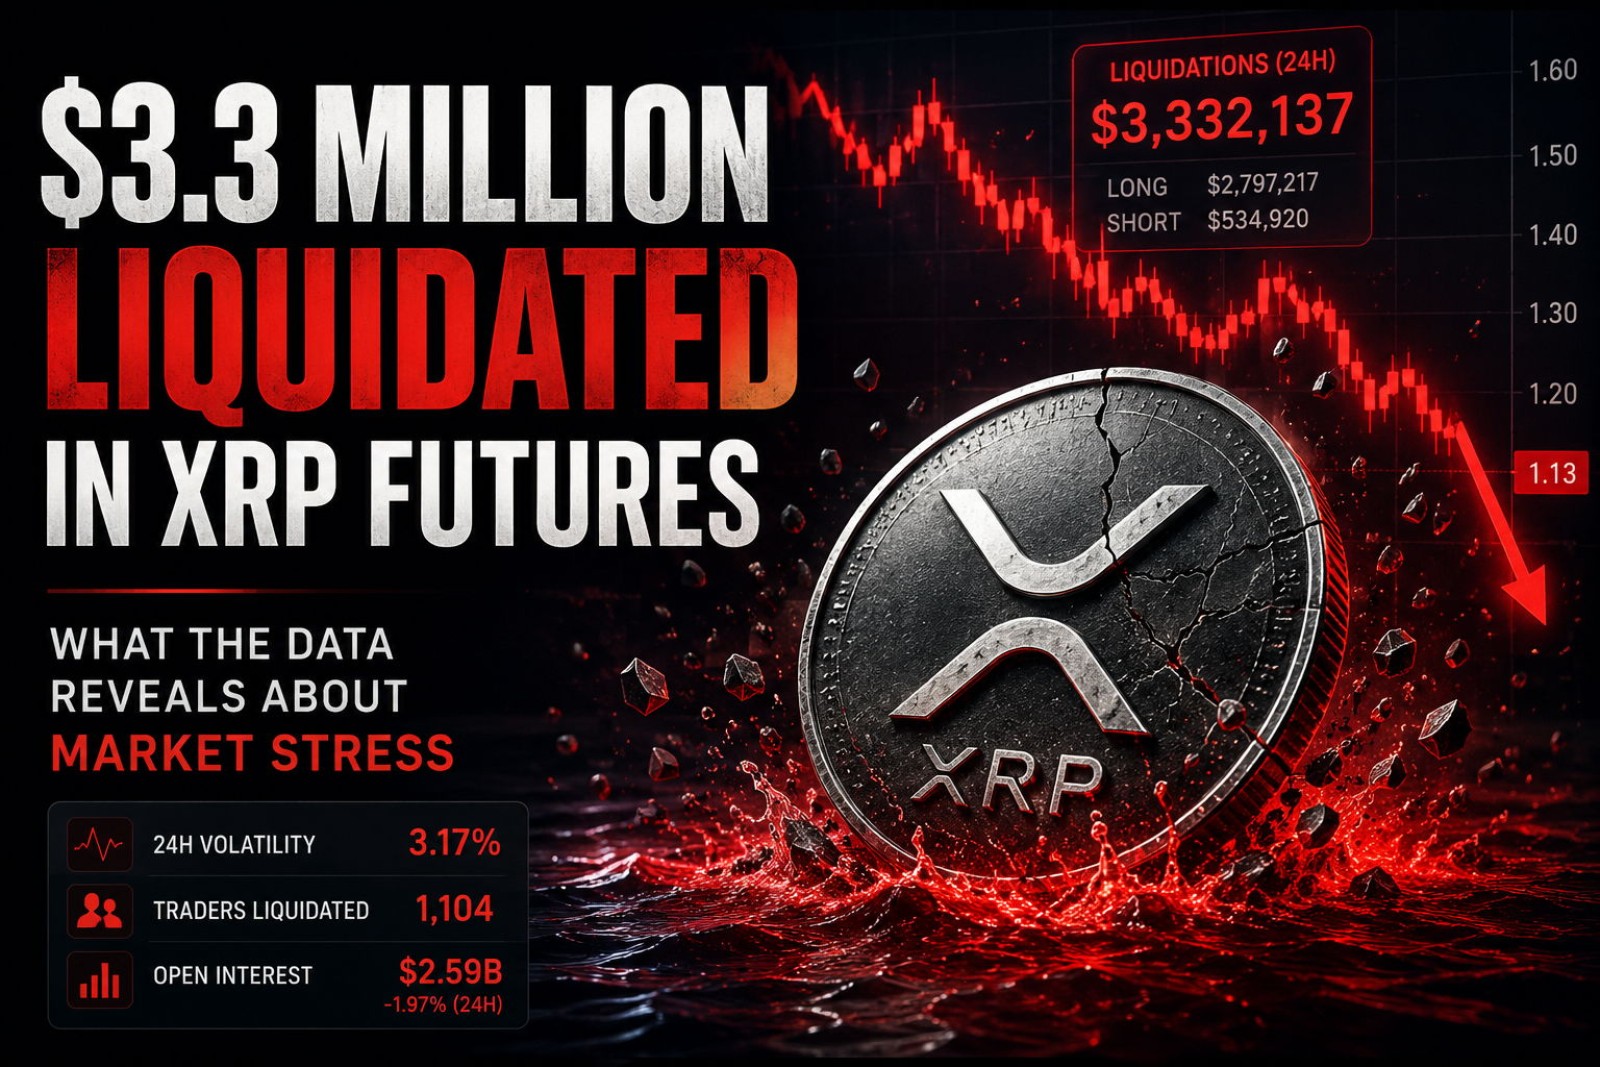
Over the past 24 hours, approximately $3.33 million in XRP futures positions were wiped out. More than 1,100 traders were liquidated, while price volatility exceeded 3%. The numbers sound significant. The more interesting story lies in what they reveal about positioning, risk, and trader behavior.
Where The Losses Came From
The liquidation data was heavily one-sided. Around $2.8 million came from long positions, compared with roughly $0.5 million from shorts.
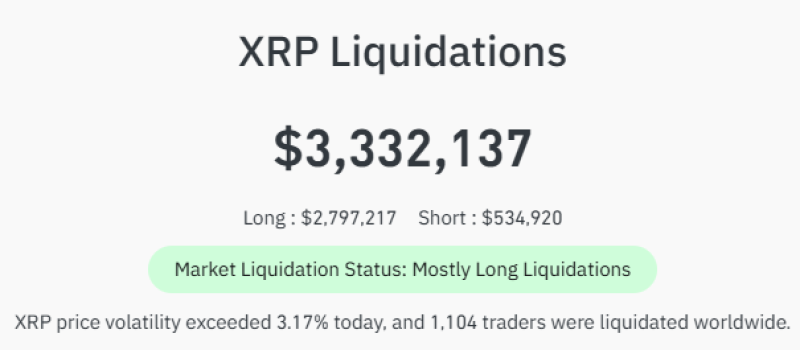
That imbalance suggests the market was crowded on one side. Many participants expected a rebound and used leverage to amplify that view. Once price moved lower, those positions began closing automatically.
The liquidation figure itself is less important than the distribution. When most forced closures come from one direction, the event highlights positioning rather than a sudden change in fundamentals.
The Trend Started Before The Liquidations
Price action had been deteriorating well before the liquidations accelerated.
After reaching the $1.50–$1.55 area, XRP repeatedly failed to establish new highs. The pattern shifted toward lower highs, followed by a steady decline that eventually pushed the asset near $1.13.
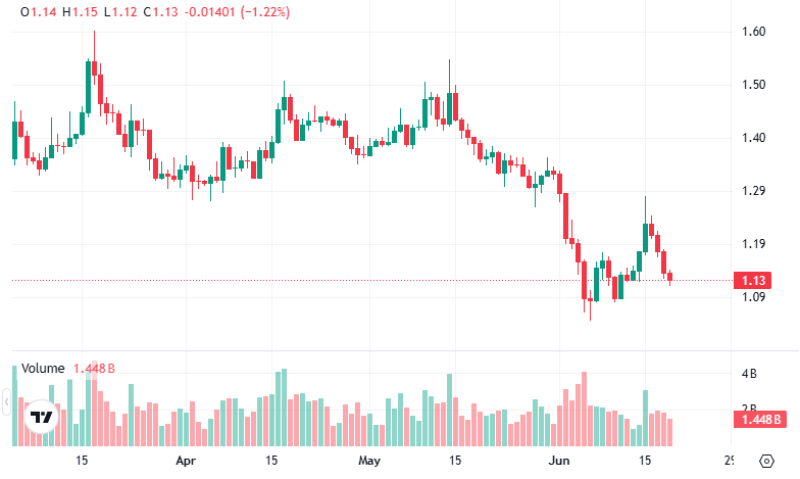
The move represents a drop of roughly 27% from recent highs. This sequence matters. The decline created pressure on leveraged traders. The liquidations simply amplified a move that was already in progress.
Mistaking the consequence for the cause is one of the most common errors when interpreting market data.
The Signal Hidden Behind The Price
While liquidation numbers attract attention, Open Interest often provides a clearer picture of what market participants are doing. XRP futures Open Interest currently stands near $2.59 billion, but it has been declining across major venues.
| Exchange | OI Change (24h) |
| CME | -1.46% |
| Binance | -1.68% |
| Bybit | -4.16% |
| KuCoin | -2.92% |
| Market Total | -1.97% |
A falling price combined with falling Open Interest usually indicates that positions are being closed and risk is being reduced. In other words, capital is leaving existing trades rather than rushing into new ones.
That distinction often says more about market conditions than price alone.
What A Deleveraging Cycle Looks Like
Markets can move lower for very different reasons. Sometimes prices fall because traders aggressively open new bearish positions. Other times prices fall because existing participants step away and reduce exposure.
The XRP data currently aligns more closely with the second case. Long positions were liquidated, Open Interest contracted, and leverage left the market. Taken together, these are typical characteristics of a deleveraging phase.
Such periods are less about conviction and more about risk management. Traders who borrowed heavily are forced to react first, while unleveraged participants can simply wait.
Looking Past The Headline
The most useful information from a liquidation event is rarely the dollar amount itself.
The XRP episode highlights four data points worth tracking together:
- Which side absorbed the liquidations.
- Whether the trend existed before the event.
- How Open Interest responded.
- Whether leverage is entering or leaving the market.
Viewed through that lens, the recent XRP move looks less like a market shock and more like a reset of excessive positioning. The headline was about $3.3 million in liquidations.
The underlying story was about leverage being removed from a market that had already begun moving lower.
 Artem Voloskovets


