 Victoria Bazir

⬤ Solana's trading at $124.37 right now, sitting in what looks like a make-or-break zone. There's this symmetrical triangle forming on the charts, squeezing the price between resistance at $206.07 and support down at $133.96. Basically, SOL's getting compressed into tighter and tighter price action as it approaches the tip of this triangle—which usually means something's about to give. The big question? Whether it'll bounce off that support floor or punch through the resistance ceiling.
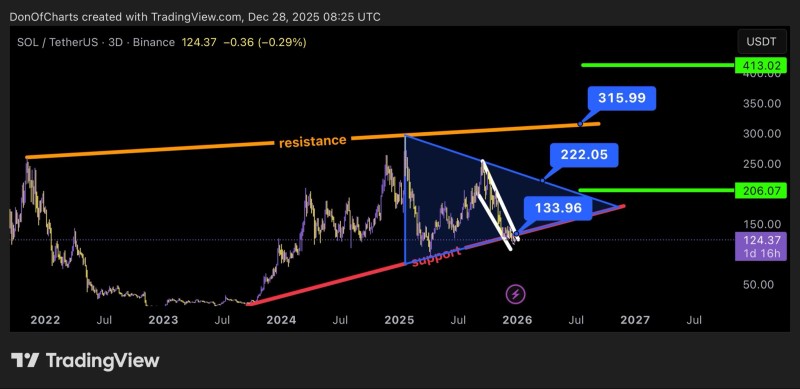
⬤ Looking at what's happening on the chart, Solana's holding steady even though it keeps bumping its head against that $206 level. This triangle pattern's telling us a move is coming, but nobody knows which direction yet. If SOL breaks above $206, traders are eyeing $315.99 as the next stop. On the flip side, if that $133.96 support zone holds strong, we might see the price pull back a bit before making its next run.
⬤ Short-term outlook? Everything hinges on these levels. Getting past $206.07 could spark some serious bullish energy and set SOL on a path toward $315. But if $133.96 cracks, we're probably looking at a deeper dive before any recovery happens. The next few weeks should tell us where Solana's heading for 2026.
⬤ Bottom line—these price levels matter. A lot. Whether Solana pushes toward that $315 target or takes a breather with a pullback, what happens at $206 and $133 will set the tone for how the market feels about SOL in the months ahead. As it squeezes toward these critical zones, Solana's next move could shape broader crypto market trends.
 Victoria Bazir


