 Usman Salis
⬤ Solana is consolidating in the mid-$120s while liquidation heatmaps reveal significant exposure on both sides of the market. Dense liquidation bands sit above $126–$130 and another major cluster waits below $120, showing that leveraged traders have positioned themselves tightly around current price levels.
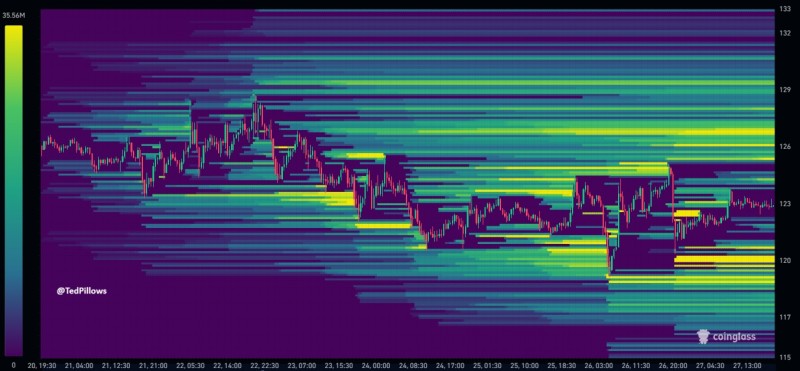
⬤ If Solana pushes into the $126–$130 zone, a wave of short liquidations would likely trigger forced buying and add upside momentum. On the flip side, a drop under $120 could unwind a large block of long positions, potentially sparking a cascading sell-off. The data shows how much leverage has piled up around these key levels in recent sessions.
⬤ The visualization shows order-book liquidity and liquidation interest have thickened around these zones, creating what looks like a compression range for SOL. Solana has been moving sideways as traders wait for a clear breakout or breakdown. Whichever way it moves next could set off a chain reaction of liquidations.
⬤ This setup matters because liquidation events can rapidly accelerate price action and shift sentiment. With SOL sitting close to both major zones, the asset is primed for a volatility surge as leverage unwinds. Traders are watching whether Solana holds above $120 or makes a decisive push toward the $126–$130 region.
 Usman Salis


