Saad Ullah
Solana has spent months grinding lower inside a descending channel, but the structure of that decline may be closer to finished than it looks. Price is now sitting on a major higher-timeframe support zone after completing what appears to be the final leg of a multi-stage ABC correction - the same type of setup that has historically preceded sharp reversals in high-beta assets. With the RSI approaching a key diagonal resistance from below and April marking a potential inflection point on the chart, traders are watching closely to see whether SOL holds its ground or breaks down further.
The 5-Wave Impulse That Defined Solana's Bullish Cycle
The chart tells a clear story. From late 2022 into early 2025, Solana completed a textbook five-wave impulsive advance - a structure marked by consistent higher highs and sustained trend expansion. That move established the bullish foundation the market is now correcting against.
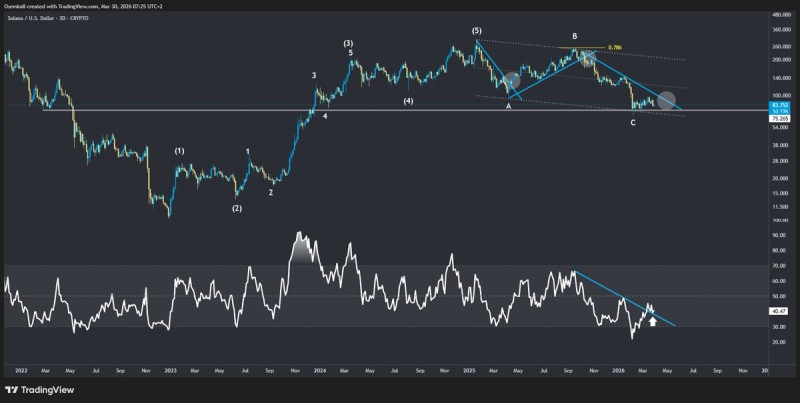
Following the impulse, SOL transitioned into an ABC correction, which has been unfolding inside a well-defined descending channel. Lower highs, controlled downside, and orderly price action within the channel's boundaries - all of it lines up with a classic post-impulse consolidation.
According to analyst Osemka, the market is currently sitting in the "C" leg of that correction - historically the final stage before a higher-timeframe reversal attempt.
Descending Channel Keeps Solana in Check
Price action has respected the channel structure throughout the decline. Every rally has been rejected at the upper boundary, and every drop has found temporary footing near the lower edge before continuation.
The market is currently positioned in the C leg of that correction - often the final stage before a potential higher-timeframe reversal.
One of the more significant developments was a sharp rejection near the 0.786 Fibonacci retracement level. That rejection reinforced the upper boundary as a strong resistance zone and sent price lower toward the current support region. SOL Price Drifts Toward $80 Support - Key Level Could Trigger a Dip First had already identified similar pressure zones forming at these levels, adding weight to what the chart is now showing.
SOL Hits Support as RSI Approaches a Key Trendline
Solana is now resting on a clearly defined higher-timeframe horizontal support base - a level that has previously acted as a meaningful floor for price action.
If support continues to hold and structure begins to break upward, it would signal that the corrective phase is ending.
At the same time, the Relative Strength Index is approaching a diagonal resistance line from below. When price holds support while RSI simultaneously breaks above a descending trendline, the combination typically signals a momentum shift rather than just a dead-cat bounce. Solana Trading Near $76 Support, $90 Range Resistance covered a similar setup, where consolidation near support preceded directional expansion.
April Marks a Critical Decision Point for SOL Price
Several conditions are now aligned at once:
- The ABC correction has matured into its final leg
- Price is sitting on a historically significant support zone
- RSI is approaching a diagonal resistance from below
- The descending channel structure remains intact but is being tested
Failure to hold current levels could extend downside pressure - but a confirmed reversal from here would signal the end of the corrective phase.
This combination is what makes the current window so important. A breakout from the channel paired with RSI confirmation would be a strong technical argument that the correction is done. On the other hand, a breakdown from support would likely extend selling pressure - a scenario that SOL Price Tests $80 as Breakdown Risk Builds outlined in detail.
Given Solana's role as a high-beta asset, a confirmed reversal here would likely carry broader implications for the altcoin market as a whole.
 Saad Ullah