 Usman Salis
⬤ Solana's been stuck in a pretty clear trading range on the 4-hour chart, with SOL bouncing off $76 support repeatedly while running into a wall near $90. This is textbook range trading - you want to take action at the edges, not in the middle. The SOL/USDT perpetual on Binance shows several failed attempts to push past $90, confirming that level as a real obstacle for bulls right now.
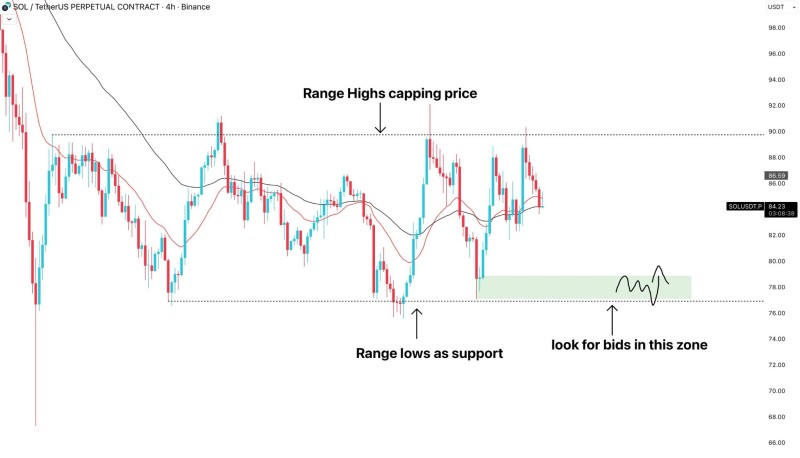
⬤ The chart clearly marks where the range highs are capping price around $90, with range lows holding as support in the $76-$78 zone. This matches up with recent technical analysis showing Solana testing critical $90 resistance after bouncing from lower levels. On the 12-hour timeframe, SOL has climbed from the bottom boundary to test the upper resistance, which just confirms the range is still very much in play. A clean break above $90 would change the game, but until that happens, expect more sideways action.
⬤ Traders are eyeing that green demand zone just above the range lows as the spot to look for buying opportunities. Meaning if SOL starts trading consistently under $76-$78, this whole range setup breaks down and opens the door to deeper drops. A bounce from support back toward the middle of the range would keep things normal and show buyers are still willing to step in. We've seen similar choppy behavior across altcoins lately, where Solana exited its downtrend but hasn't found clear direction yet.
⬤ The big takeaway here is that Solana's short-term path is all about these horizontal boundaries rather than any strong trend. With $90 acting as a ceiling and the lower band holding as a floor, the range defines what's possible right now. Breaking above could spark renewed upside momentum, while dropping below support would signal weakening demand and potential acceleration lower. Watching these levels remains key to understanding where SOL heads next.
 Usman Salis


