Peter Smith

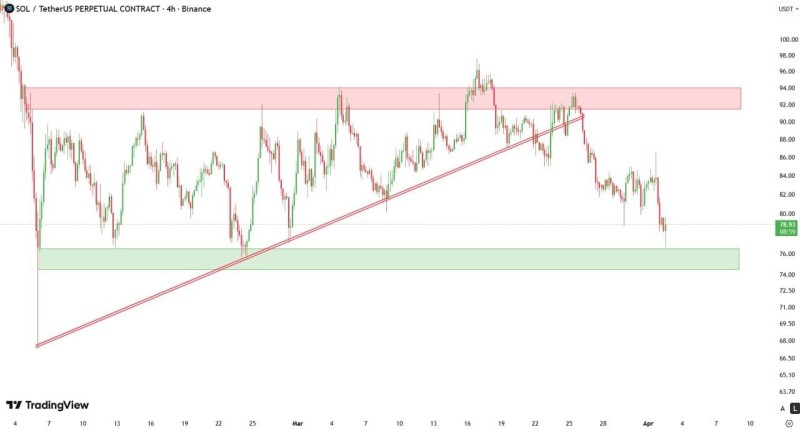
Solana is under pressure after losing its rising trendline structure, with price now sitting at a critical support zone that could define the next short-term move. Analysis from Marcus Corvinus highlights a clear structural shift as SOL moves into a decisive area where bulls and bears are set to collide.
How the SOL Trendline Breakdown Changed Structure
The chart shows SOL losing its rising trendline, marking a notable change in market structure. Price action no longer holds higher lows, signaling a shift in momentum away from the trend that had been guiding price higher.
This aligns with broader SOL technical behavior, where losing key trendlines often marks a transition from trend support into corrective or bearish phases. Once that structural anchor is gone, price tends to drift toward the next major level rather than stabilize quickly.
Why the $92–$95 Resistance Zone Rejected SOL
The $92–$95 zone stands out as a firm resistance area on the chart. Price attempted to push into this region but was rejected, confirming it as a level where sellers were willing to step in with conviction.
This kind of rejection is consistent with previous Solana setups, where descending resistance zones repeatedly capped upside attempts before further downside developed. Each failed push into resistance adds weight to the bearish case.
SOL Enters the $75–$78 Decision Zone
Price is now sitting within the $75–$78 range - a level the chart identifies as key support and a genuine decision point for the market. What happens here is likely to set the tone for the near-term trend.
If support holds, a sharp reaction higher is possible. If it breaks, downside can accelerate quickly.
This reflects a classic compression into support dynamic, where repeated tests of the same level increase the probability of a larger directional move once the zone finally resolves. The market is essentially coiling at a line in the sand.
What SOL's Structure Depends On Now
The current setup hinges entirely on whether the $75–$78 zone holds. Recent price behavior shows that repeated testing of support tends to weaken it over time, especially when price consistently fails to form higher highs above it.
Repeated tests of the same support level don't build confidence in it - they erode it.
Comparable structures in Solana have shown that once key support levels give way, price can move rapidly toward lower zones with limited intermediate support to slow the decline. The lack of meaningful structure between current levels and lower targets makes a clean break particularly dangerous.
Solana's Next Move Hinges on This Support Test
For now, SOL remains parked at this level with the market waiting for a resolution. The trendline is gone, resistance above is firm, and the support zone below is under active pressure.
The next move out of this zone - whether higher or lower - is likely to be swift and significant.
Solana has been through similar setups before, and each time the outcome at support defined weeks of price action that followed. Traders watching SOL right now are looking at one of the cleaner decision points the chart has offered in recent weeks.
 Peter Smith