 Marina Lyubimova
Solana is facing downward pressure as it hovers near important support zones. After a tough stretch for crypto markets, SOL is stuck in a tricky spot—caught between holding support and breaking through resistance. Macroeconomic worries, especially tariff news, aren't helping sentiment either.
Current Technical Picture
According to analyst DeltA, Solana's chart tells a bearish story right now. Since mid-September, SOL has been making lower highs along a descending trendline. Every time buyers try to push higher, sellers show up and shut it down. The coin is currently testing support around $185–$182, a level that's held before but looks increasingly fragile. If it breaks, traders are eyeing $176 and then $168 as the next stops.
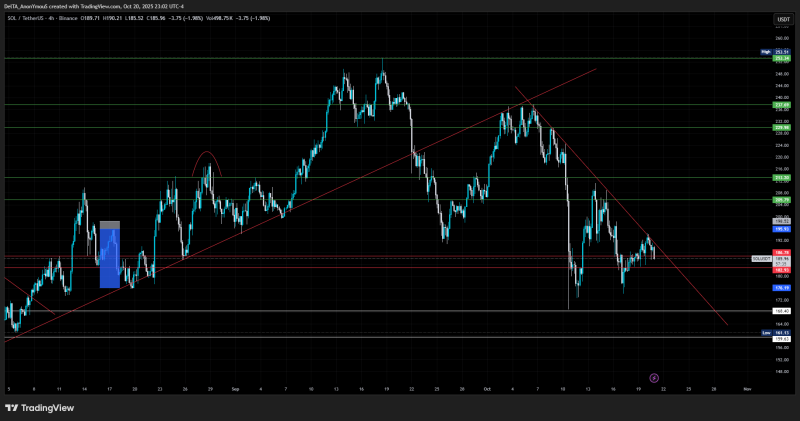
On the upside, that red trendline around $195–$198 is acting as a ceiling. Breaking above it—and especially above $205–$213—would signal a potential shift back to bullish territory. Beyond that, resistance zones sit at $230, $238, and $253.
What's Driving the Weakness?
Trade tariff headlines have spooked markets lately, and altcoins like Solana tend to get hit harder during uncertain times. When big players pull back, liquidity dries up and prices get choppy. Volume has been dropping too, which suggests most traders are sitting on the sidelines waiting for clearer direction.
For Solana to flip bullish, it needs to break above that descending trendline and push past $205. Until then, the path of least resistance might still be down. If $182 fails to hold, we could see another leg lower toward $168 or even $161. On the flip side, reclaiming those higher levels could bring buyers back into the game and set up a proper recovery.
 Marina Lyubimova


