 Usman Salis
⬤ Solana's monthly chart is painting an interesting picture right now - a macro head and shoulders pattern that's got traders watching closely. The structure shows three distinct peaks across the cycle, and price has pulled back to test what looks like a well-defined neckline zone. SOL is sitting right above this support area, which makes this moment pretty critical for understanding where things might head long-term.
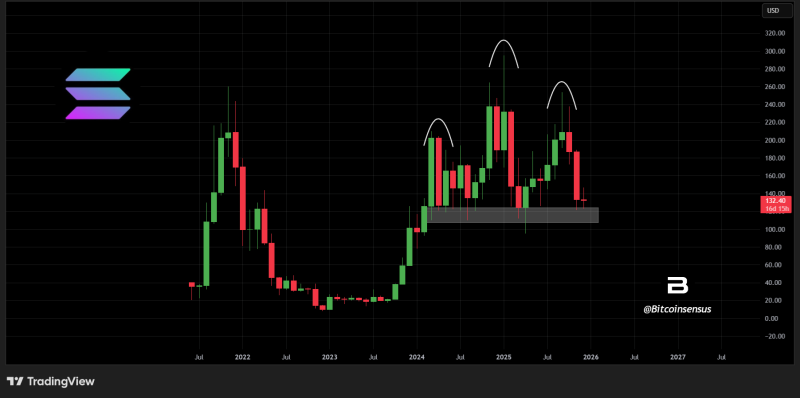
⬤ Looking at the chart, you can see Solana pushed toward that $250-300 range before losing steam - that's your head. The rallies that followed didn't reach as high, creating the left and right shoulders on those monthly candles. The neckline runs across several consolidation lows, and it's the line in the sand that technical traders are keeping their eyes on to see if this pattern actually plays out or fizzles.
⬤ Recent monthly candles show price holding steady within a demand zone around the neckline. There's a cluster of wicks and closes near this area, suggesting sellers are running into buyers who aren't ready to let it drop further. "The neckline should hold to allow for higher price development in the future," as the analysis notes - and right now, the market seems to be testing that thesis rather than breaking through.
⬤ This setup matters because Solana tends to mirror broader crypto market sentiment. If the neckline holds, the pattern stays incomplete and price can consolidate instead of heading lower. But if we see a clean monthly close below this zone, it confirms the head and shoulders on the macro timeframe and signals continued weakness. With price hanging around this critical level, traders are watching those monthly closes carefully to see which way this breaks.
 Usman Salis


