 Usman Salis

⬤ Solana is sitting at a critical spot right now, and the derivatives data tells an interesting story. If SOL pushes up just 15% from current levels, we're looking at roughly $1.06 billion in short liquidations getting triggered. Drop the same distance downward? Only about $474 million in longs would get wiped out. The liquidation map puts SOL around $126, where leverage starts building up fast on both sides.
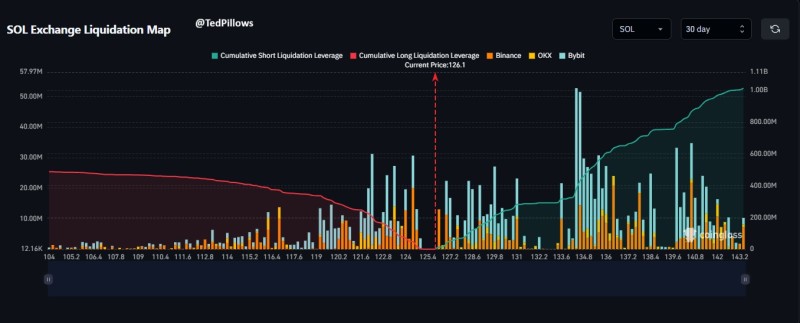
⬤ Looking at the 30-day cumulative liquidation data across major exchanges, there's a clear pattern. Above the current price, short liquidation leverage shoots up dramatically—meaning there's a packed crowd of short positions waiting to get squeezed if price climbs higher. As SOL approaches the $135-$145 zone, that short liquidation curve races toward the billion-dollar mark. Below current price? The liquidation pressure grows way slower, showing there just aren't that many leveraged longs in the game right now.
⬤ Data from Binance, OKX, and Bybit all show the same thing—shorts are dominating the exposure across the board. SOL is basically parked right at the edge of a zone where upside moves could trigger a cascade effect. When shorts start getting liquidated, it forces buying, which pushes price higher, which liquidates more shorts. It's a domino effect that can amplify volatility fast.
⬤ This setup matters because liquidation imbalances like this often drive short-term price action. When one side of the market is carrying more than double the leveraged exposure—like we're seeing here with shorts versus longs—any move in that direction can accelerate quickly. For Solana traders, the area above $126 is shaping up as a key zone that could define momentum and volatility in the near term.
 Usman Salis


