 Marina Lyubimova

⬤ Solana saw a decisive technical breakdown on the weekly chart as selling pressure intensified into early February. SOL printed a large red weekly candle of approximately minus 13 percent, pushing price firmly below a multi-year support area around $120. The chart confirms this move, showing a clean downside break of a level that had previously acted as a key demand zone.
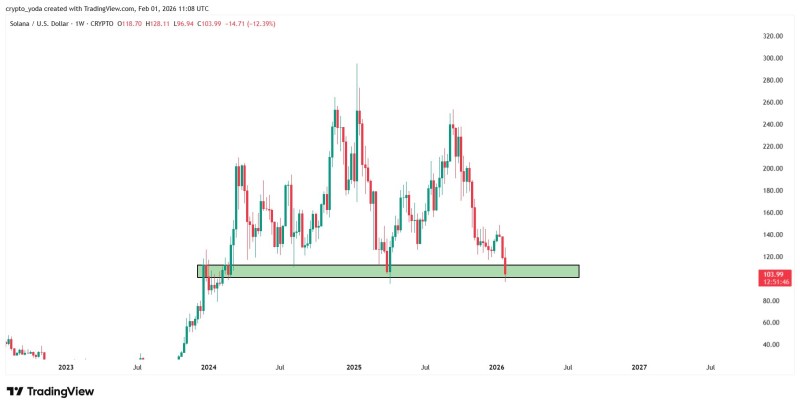
⬤ The $120 region had served as an important structural base for Solana across multiple market phases, absorbing downside pressure during earlier pullbacks. On the current weekly chart, price didn't just test this zone—it closed well below it, near the $104 area. This type of weekly close typically carries more technical weight than short-term intraday violations, signaling sustained selling rather than a temporary breakdown.
⬤ The broader price structure leading into the move shows weakening momentum, with lower highs forming ahead of the breakdown. Once SOL lost the multi-year support band, downside acceleration followed quickly—consistent with stop-driven selling and a lack of nearby higher-timeframe support. The size of the weekly candle highlights just how fast the market repriced Solana after the support failure.
⬤ This development matters for the wider crypto market because Solana remains one of the most actively traded large-cap altcoins. A confirmed loss of multi-year support on the weekly timeframe can influence market sentiment, impact capital allocation across the altcoin space, and shift expectations around trend stability. With SOL now trading below a historically important level, upcoming weekly closes will be closely watched for signs of stabilization or further downside continuation.
 Marina Lyubimova


