 Usman Salis
⬤ Solana's hitting a rough patch after its latest rally ran out of steam. The 12-hour chart shows SOL getting rejected near $144.62 before sliding back toward the middle of its range. Right now, the focus is shifting to $119.54—a level that's proven important in previous pullbacks and could determine where price heads next.
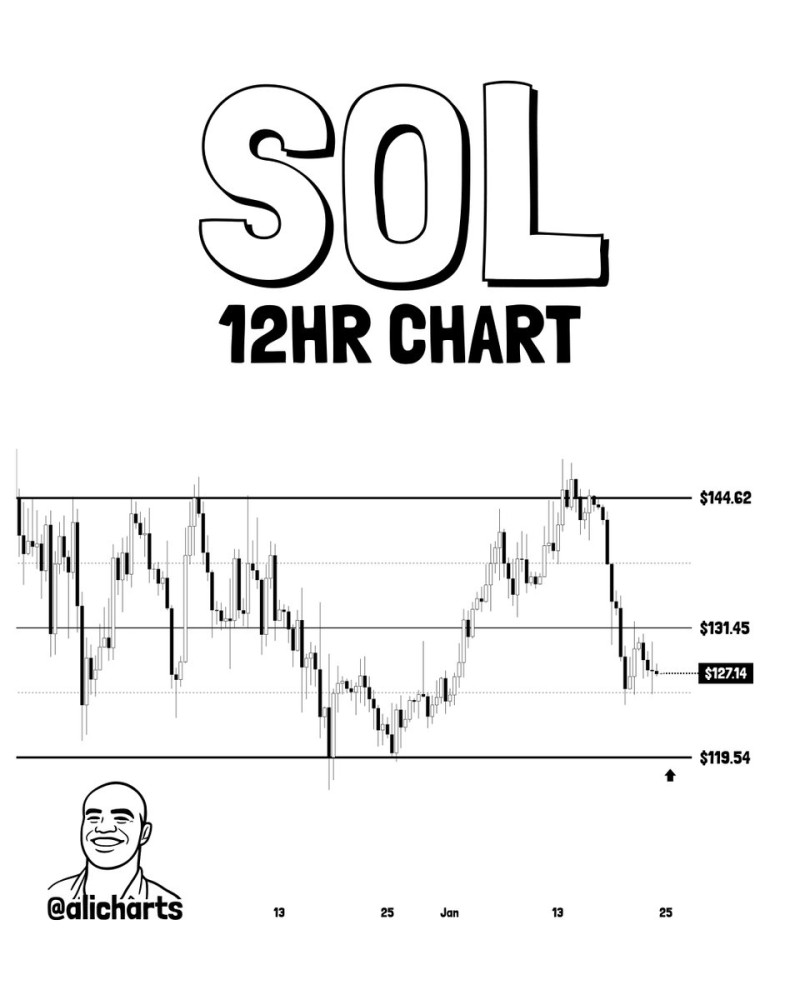
⬤ Looking at the broader picture, SOL's been trading inside a clear horizontal range for weeks. The rally from $119.54 up to resistance around $144.62 looked promising until buyers lost momentum. Price dropped back below the midpoint at $131.45, which had been holding as short-term support. Breaking through that zone ramped up selling pressure and put the lower boundary back in play.
⬤ What makes $119.54 stand out is how price has stabilized there before. It's where buyers have stepped in during past selloffs, making it a natural area to watch. There's no reversal signal yet—SOL's still in correction mode rather than gearing up for another leg higher. The key question is whether support holds or breaks when price tests that level again.
⬤ This matters beyond just Solana. As one of crypto's major altcoins with a strong ecosystem, how SOL behaves at key levels tends to influence broader market sentiment. Whether $119.54 holds or fails could shape short-term volatility across the sector and signal whether this range structure stays intact or starts breaking down.
 Usman Salis


