 Alex Dudov

Shiba Inu is entering a critical technical phase where price action has gone quiet - but the structure suggests that calm may not last. According to analyst SHIB Mortal, the chart shows SHIB compressed between a long-term descending resistance line and a flat support zone, creating a setup where volatility is likely to expand significantly.
A SHIB Downtrend That Continues to Define Price
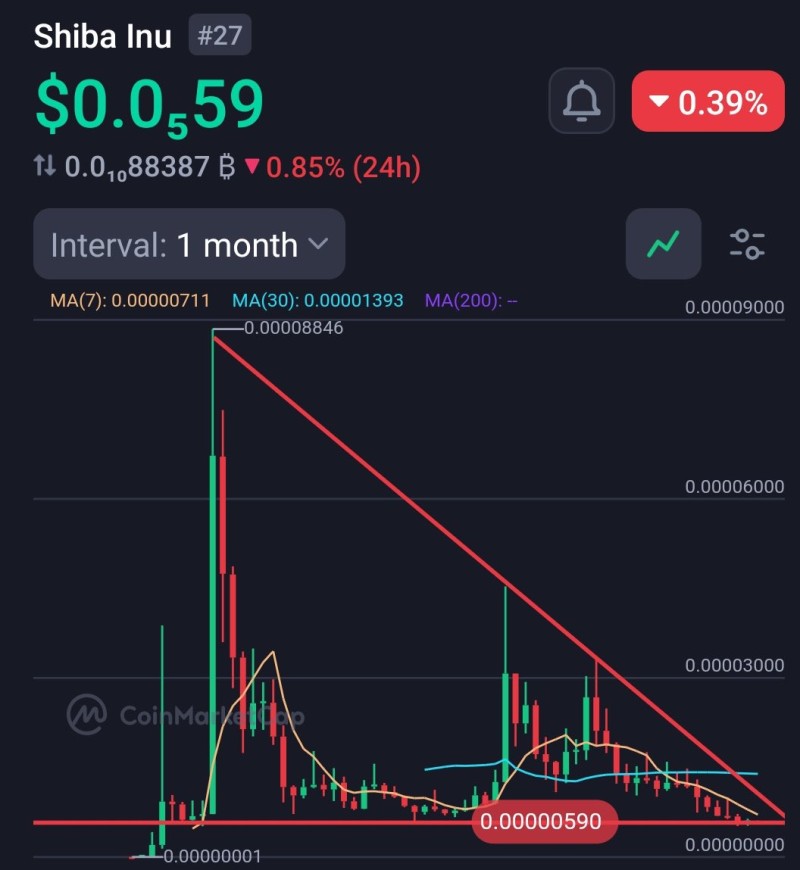
The dominant structure on the chart is a clear descending trendline extending from the all-time high near 0.000088. Each rally attempt since that peak has failed below this line, reinforcing a sequence of lower highs.
This repeated rejection is not coincidental - it defines the broader trend. Price remains unable to break above this descending resistance, and each attempt has resulted in renewed selling pressure.
Recent context makes the setup even more relevant. SHIB tightens range as Bollinger Bands signal breakout, with technical indicators continuing to narrow around a decision point that the market has not yet resolved.
A Floor That Keeps Getting Tested
On the downside, SHIB is holding near a horizontal support level around 0.0000059. This area has acted as a consistent base, preventing deeper declines despite repeated pressure from above.
However, the nature of the reactions is changing. Each bounce from this level has been weaker than the previous one, with reduced follow-through and lower highs forming quickly after. This reflects a gradual absorption of demand - where buyers are still present, but less aggressive over time.
Each bounce carries less momentum than the one before it - demand is still there, but it is thinning out with every retest.
- Repeated touches at 0.0000059 with weakening upside reactions
- Lower highs forming faster after each bounce
- Declining candle size pointing to fading directional momentum
- Volume absorption suggesting buyer exhaustion near key support
Similar patterns of repeated support testing and compression have been observed in recent SHIB setups. Shiba Inu analysis covering new wallet surge and 7,000% burn rate highlighted how price holds key levels but builds pressure for a larger move - a dynamic playing out again now.
SHIB Compression Signals a Pending Move
The most important feature of the current chart is the tightening range. Price is being squeezed between descending resistance and flat support, while volatility continues to decline. Candles are becoming smaller, and directional momentum is fading - classic signs of a market preparing for expansion.
Compression of this kind rarely resolves sideways - the tighter the range, the more decisive the eventual move tends to be.
This type of compression has been widely observed in SHIB price action, often preceding sharp moves once the range resolves. The structure itself does not confirm direction - but it does indicate that a move is coming. SHIB broke short-term resistance in a fresh pump under comparable compression conditions previously, demonstrating the asset's tendency for abrupt directional shifts.
The Break That Will Define the Next SHIB Phase
The setup leaves little room for indecision. If price breaks below the support zone, the broader downtrend would likely continue - extending the pattern of lower highs and pushing SHIB into new lows. On the other hand, reclaiming the descending trendline would be required to shift structure and signal a potential reversal.
For now, SHIB remains compressed at a critical level, where quiet price action masks a market that is increasingly close to a decisive move.
 Alex Dudov


