Usman Salis

The chart tells a familiar story for SEI holders - a steady grind lower, with the large gap between price and the 200-day moving average underlining just how deep the current downtrend runs. CyrilXBT flagged the setup, noting that the lack of conviction from buyers remains the defining feature of the current structure, with volume offering little support for a reversal.
SEI Downtrend Refuses to Break
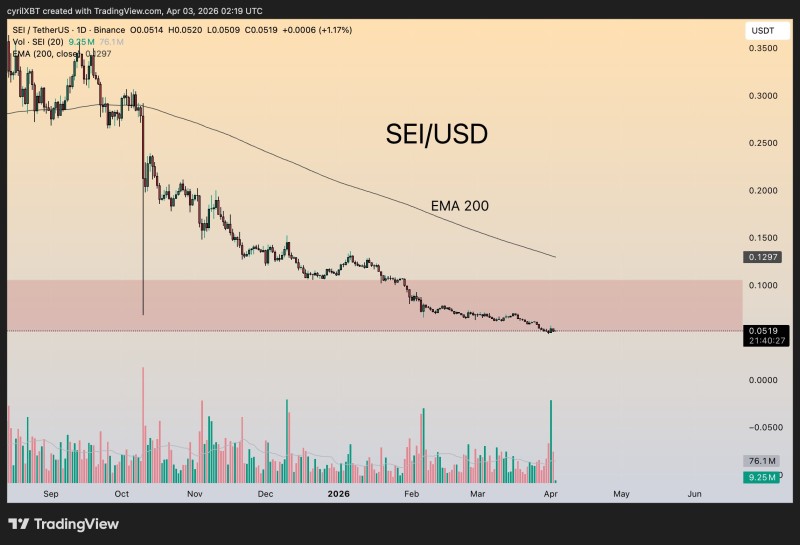
SEI's daily chart shows a prolonged bearish structure, with price consistently forming lower highs and lower lows over recent months.
The lack of conviction from buyers remains the defining feature of the current structure, with volume offering little support for a reversal.
Currently sitting around $0.0519, the asset is trading near the bottom of its range, with no visible breakout attempts or strong bullish reactions. Instead, price continues to drift lower in a controlled manner - suggesting sustained selling pressure rather than any early signs of reversal. As SEI Price Analysis: Bullish RSI Divergence Signals Potential Rebound outlined, even early divergence signals during the decline failed to attract meaningful follow-through from buyers.
200 EMA at $0.1297 Highlights How Far SEI Has Fallen
One of the most striking elements in the chart is the position of the 200 EMA, currently sitting near $0.1297 - more than double the current trading price.
Price is significantly below this level, reinforcing how detached the current trend has become from any broader bullish structure. The 200 EMA is not actively influencing price - it remains far above current trading levels, and that distance alone emphasizes the strength and maturity of the downtrend. Until price gets anywhere close to reclaiming it, the moving average functions more as a marker of how bad things are than as a near-term target.
Volume Reflects a Lack of SEI Market Participation
The volume profile reinforces the same narrative. There is no consistent expansion in buying activity, and no clear signs of accumulation near current levels. Even in moments of minor recovery, volume does not meaningfully increase - confirming the absence of strong demand. Markets reverse on conviction, and right now that conviction simply is not there.
Even in moments of minor recovery, volume does not meaningfully increase, confirming the absence of strong demand.
This lack of participation mirrors broader technical commentary on SEI, where analysts continue to highlight weak momentum and limited buyer engagement throughout the ongoing decline. For additional context on how price has behaved at key levels during this decline, SEI Tests $0.065 Demand Zone After 94% Drop covers an earlier phase of the same structure.
The Only Level That Matters for a SEI Reversal
Despite the ongoing weakness, a clear condition for change has been defined. A move above $0.10 with strong volume would be required to shift the current structure. Until that happens, the trend remains bearish, with price continuing to respect its downward trajectory. That level is not arbitrary - it represents the point where buyers would need to demonstrate real commitment, not just a brief relief bounce. SEI Eyes 400% Rally as Price Tests Critical Support Zone breaks down exactly what a structural recovery would need to look like from current levels.
 Usman Salis