 Victoria Bazir
SEI token is setting up what could be one of the most significant technical patterns in recent months. After spending years trapped in a downward compression, the Layer-1 project now sits at a critical juncture where price action could finally break free. With the token hovering just above multi-tested support and a descending trendline closing in, traders are positioning for what might be a massive breakout. The question isn't whether something big is coming—it's whether SEI can hold the line long enough to launch toward targets that seem almost too good to be true.
Critical Moment for SEI Token
SEI is hitting one of its most important technical levels, catching traders' attention as they watch for a momentum shift. The token sits near the bottom of a multi-year squeeze pattern, with the $0.15–$0.13 zone looking like the sweet spot for accumulation before a potential climb to $0.70—roughly 400% gains.
As SEI approaches the tip of a long descending trendline, market watchers are trying to figure out if we're seeing the start of a major turnaround.
Technical Setup: Tightening Pattern and Key Price Levels
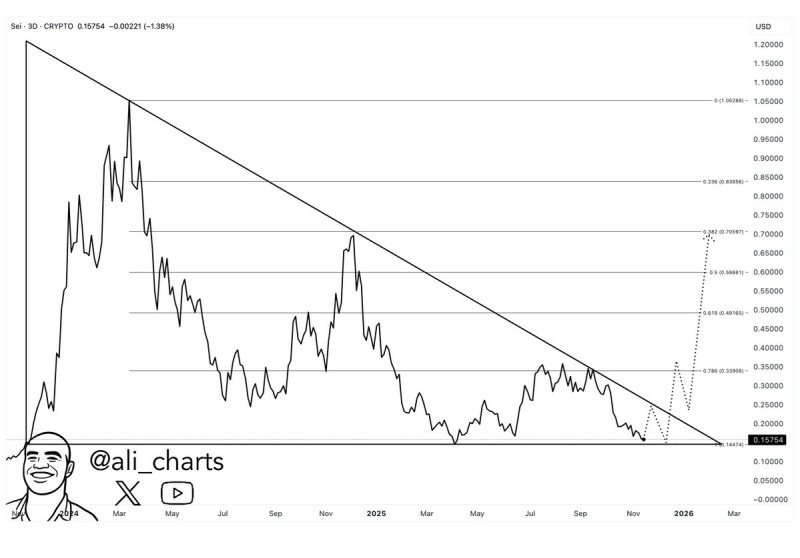
SEI currently trades around $0.157, just above strong horizontal support near $0.144. This floor has held up through repeated tests over the past year of sideways action. Meanwhile, a downward sloping trendline from early 2024 keeps capping rallies, creating a wedge that's getting tighter and tighter as it nears its breaking point.
Looking at Fibonacci levels from the previous cycle peak, here's what traders are eyeing for upside targets:
- 0.786 → ~$0.339
- 0.618 → ~$0.491
- 0.5 → ~$0.598
- 0.382 → ~$0.706
- 0.236 → ~$0.838
The technical chart shows two bullish scenarios, both featuring SEI breaking above that descending trendline and pushing toward these Fibonacci targets. That $0.70 projection lines up perfectly with the 0.382 level, backing up the 400% rally thesis.
Why This Support Zone Matters
The $0.13–$0.15 area has proven resilient through multiple retests, hinting that selling pressure might be running out of steam. SEI's extended consolidation looks similar to patterns that historically came before big directional moves. As the wedge tightens, any change in sentiment or liquidity flow could spark serious volatility.
The broader market backdrop helps too—Layer-1 projects are getting fresh attention, risk appetite is coming back to altcoins, and long consolidation phases like this often set up explosive moves when the overall market catches fire.
What's Next for SEI
SEI is at a make-or-break moment as it trades within the $0.15–$0.13 accumulation zone and approaches the end of its multi-year descending structure. If buyers step up to defend this region and SEI can push above its upper trendline, the path forward points clearly toward $0.33, $0.49, and eventually $0.70. With the technical picture getting tighter by the day, the next few weeks could decide whether SEI breaks out from years of compression into a fresh bullish cycle.
 Victoria Bazir


