Alex Dudov

⬤ SEI kicked off a quick rebound after holding strong at the $0.106 support zone on the 10-minute chart. The price was moving sideways before taking a quick dip toward $0.106, where buyers jumped in to protect that level. From there, SEI turned upward and started climbing toward nearby resistance zones. The token is now pushing toward the $0.115 area.
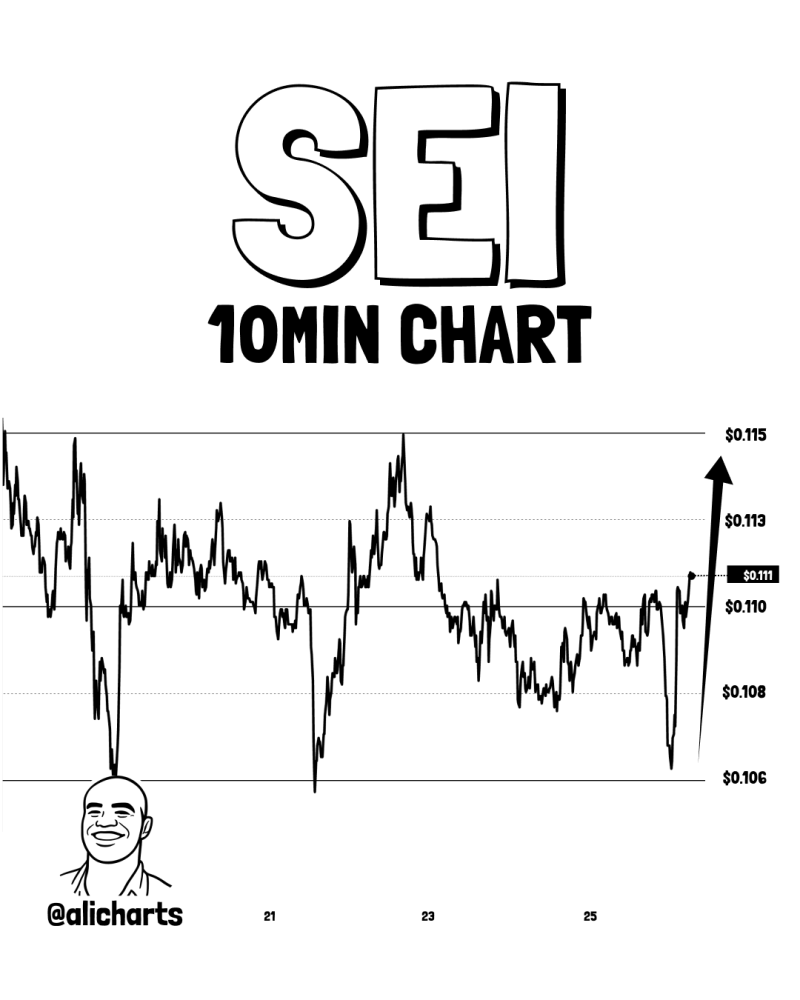
⬤ The chart shows several key levels that have been driving recent price action. Right now, SEI is trading around $0.111, with resistance sitting near $0.113 and the next target at roughly $0.115. Over the past few sessions, price has been bouncing between $0.108 and $0.113 before this latest upward push. The $0.106 level is proving to be solid support since the price tested it and bounced back, showing buyers are still defending that zone.
⬤ On this short timeframe, SEI's price action shows typical reactive market moves with quick swings between support and resistance. The chart points to an expected bounce trajectory toward $0.115 if the current momentum holds. But the recent choppy moves also show how fast SEI can jump between key levels during active trading sessions.
⬤ This matters because staying above $0.106 confirms that level's importance while SEI tests the upper end of its recent range. Whether SEI can keep pushing toward $0.115 or gets stuck in consolidation will likely shape near-term trader sentiment and how the market reacts to the token in the coming sessions.
 Alex Dudov