 Alex Dudov
⬤Litecoin is drawing renewed attention after holding a key level on the weekly chart. LTC bounced from the 0.786 Fibonacci retracement near $45, a zone that previously absorbed selling pressure during past corrections. Since that bounce, price has climbed toward the mid-$50s and is now pressing against a descending trendline that has repeatedly capped upside momentum. Traders are watching closely to see whether this test produces a genuine breakout or another rejection.
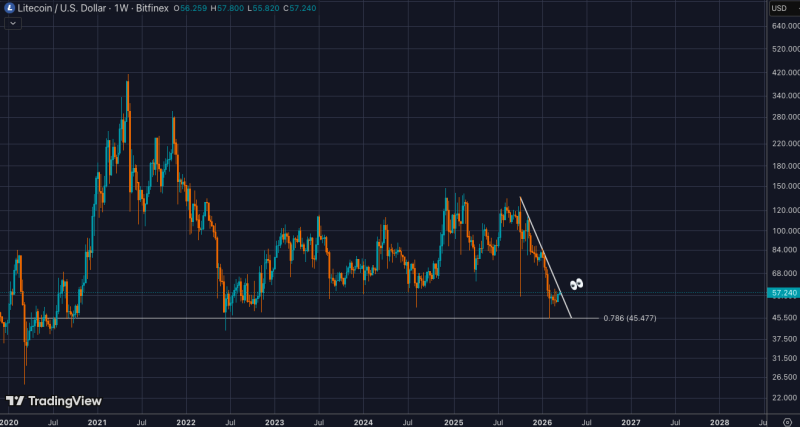
⬤The move follows a prolonged consolidation after LTC retraced from higher cycle levels into the mid-$40 range. The 0.786 retracement triggered a recovery that pushed price back toward the trendline connecting recent lower highs. Litecoin Defends Critical $46-$54 Support Zone noted that this region has historically served as a strong demand area, with buyers stepping in each time price approached those levels during broader market pullbacks.
⬤The main technical question now is whether LTC can clear the descending resistance. Downtrend lines mark zones where sellers consistently re-enter and suppress rallies. A confirmed break above would shift the structure away from lower highs and open the door to a broader recovery. Litecoin Approaches Key Downtrend Reversal Zone highlighted a nearly identical setup, where LTC tested a long-standing descending line while momentum indicators quietly improved in the background.
⬤The meeting point between the 0.786 Fibonacci support and the descending resistance creates a compressed technical setup that often precedes a sharp directional move. When price recovers from deep retracements and hits established resistance, volatility tends to rise as participants take sides. LTC Tests $53 Support Zone After Multi-Year Range Floor Revisit explored how reactions near long-term support can either extend consolidation or mark the beginning of a new trend phase. The trendline interaction ahead may determine which path Litecoin takes next.
 Alex Dudov


