 Marina Lyubimova

⬤ Litecoin is testing a critical zone on the weekly chart, returning to horizontal support near the low-$50s that has historically held during previous cycles. Noted that buying interest typically emerges at or below this level, which has consistently marked demand re-entry points. The chart shows repeated bounces from the same price area, demonstrating consistent market behavior across multiple cycles.
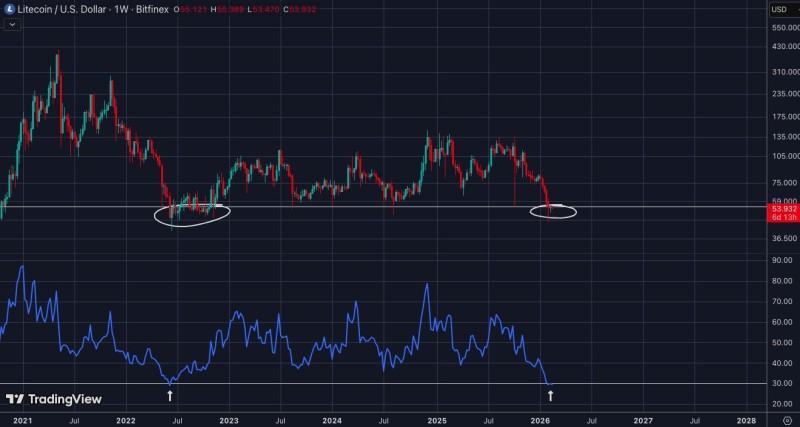
⬤ LTC's price structure reveals a pattern of rebounds whenever it drops into this range. Instead of breaking down, the market has historically formed accumulation zones at this level. The momentum oscillator currently shows readings similar to past bottoming phases, suggesting Litecoin sits near historically weak sentiment conditions. This behavior mirrors earlier Litecoin accumulation phases when patient buyers stepped in at similar price levels.
⬤ Recent price action brought LTC back to support following a series of lower highs. The market now compresses near this horizontal floor, with traders watching to see if it holds or finally breaks. Previous reactions from this zone led to stabilization and eventual range expansion, making it structurally important for near-term direction. Similar setups appeared during major Litecoin support retests in past years.
⬤ This long-term support test puts Litecoin at a technical crossroads. A sustained hold preserves the multi-year range structure that has defined price action, while a breakdown would break the cyclical pattern that has repeatedly shaped market behavior. The market's reaction around $53 may determine whether LTC continues its consolidation pattern or enters a new volatility phase.
 Marina Lyubimova


