Alex Dudov

Litecoin is once again hovering near one of its most important long-term technical levels. At roughly $53.7, the asset is trading directly within a support zone that has shaped price behavior across more than a decade of market history. For long-term traders, this region is not just a number - it is a structural anchor that has repeatedly drawn buyers back during deep corrections.
A Decade of LTC History Points to $53 as a Key Floor
The weekly chart tells a consistent story. Each time Litecoin has pulled back sharply from a major bull run, price has eventually found its footing near this same zone. The pattern is not coincidental - it reflects where long-term participants tend to view the asset as undervalued. As noted in Litecoin Tests 2017 Support Level With $1000 Price Target in Play, LTC has historically rebounded from structural supports that were first established in earlier market cycles, giving this area an unusual degree of technical significance.
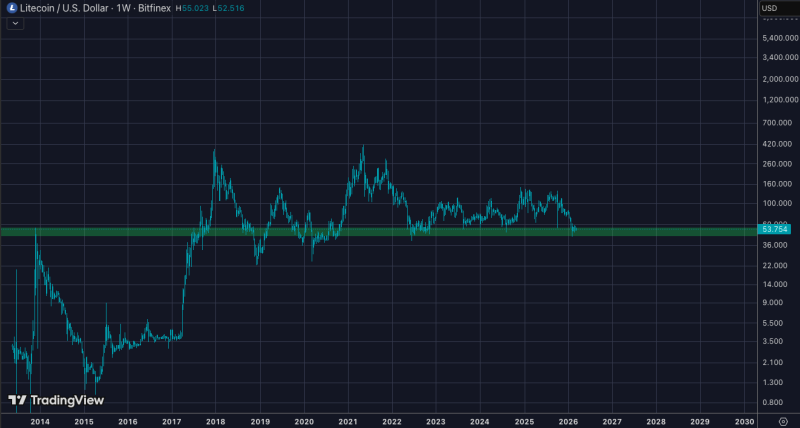
$52-$53 Range Remains the Critical Demand Zone for LTC Buyers
The broader range from $52 to $53 has now drawn attention across multiple analyses. Litecoin Drops After $55 Resistance Test - Key Support Zone at $52-$53 Now Critical highlights how this band continues to function as a demand area where buyers consistently step in during pullbacks. The $55 level above has acted as resistance, meaning the market is effectively caught between two well-defined levels - a setup that typically resolves with a directional move once one side gives way.
Broader context reinforces this reading. Litecoin Eyes $74 Support Level After Sharp Decline describes how LTC tends to trade within defined ranges where structural floors are defended before any meaningful recovery develops. Whether the current consolidation near $53 leads to a rebound or a deeper breakdown, this weekly support zone will remain the decisive reference point for Litecoin's price behavior as the broader crypto market moves through its next cycle phase.
 Alex Dudov