 Saad Ullah

⬤ Litecoin followed through on the anticipated pullback after hitting resistance, though sharp candle wicks caught many traders off guard. The coin traded around $55.85 before reversing, with several market participants noting the aggressive wick action "knocked them out" of their positions despite calling the move correctly. The LTC/TetherUS perpetual chart on Binance shows price now hovering near mid-range levels following the rejection from upper resistance.
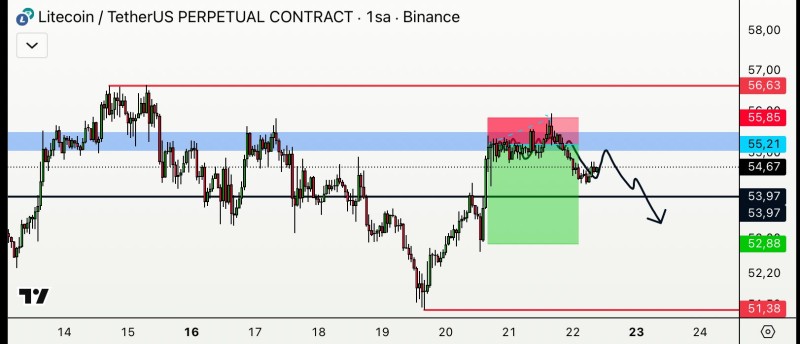
⬤ On the hourly timeframe, Litecoin clearly rejected from the resistance zone marked in blue, with a red band extending from $55.21 to $56.63. After failing to hold above this area, price reversed toward the black pivot near $53.97 before dropping into the broader green demand zone around $52.88. The lower boundary sits near $51.38, marking the intraday support where buyers previously stepped in. This range structure reflects typical retracement behavior and confirms the pullback scenario discussed in recent analysis.
⬤ Traders were advised to hold off on new positions, focusing instead on managing existing risk as price consolidates. The sharp wicks highlight increased liquidity sweeps that can trigger stops on both sides of the range. While the pullback has been relatively orderly into defined support, the current consolidation suggests neither bulls nor bears have clear control. For broader context on LTC's recent behavior, see Litecoin Tests Key Support After Rejection at $68 Level, which outlines downside reaction zones, LTC Price Outlook: Resistance Rejects Highlight Range Risk.
⬤ The current price action underscores how Litecoin's short-term range structure and intraday volatility can shape breakout or breakdown scenarios. With LTC reacting within clearly defined resistance and support zones, watching how price interacts with these levels becomes crucial for assessing potential continuation or further retracement.
 Saad Ullah


