Usman Salis
⬤ Litecoin (LTC) is reaching a decisive point after years of sideways movement. The price has traced a large triangle on the weekly chart - each leg of the pattern is labeled A through E in Elliott Wave terms. Litecoin now trades at about 83.77 USD while the upper and lower borders of the triangle converge.
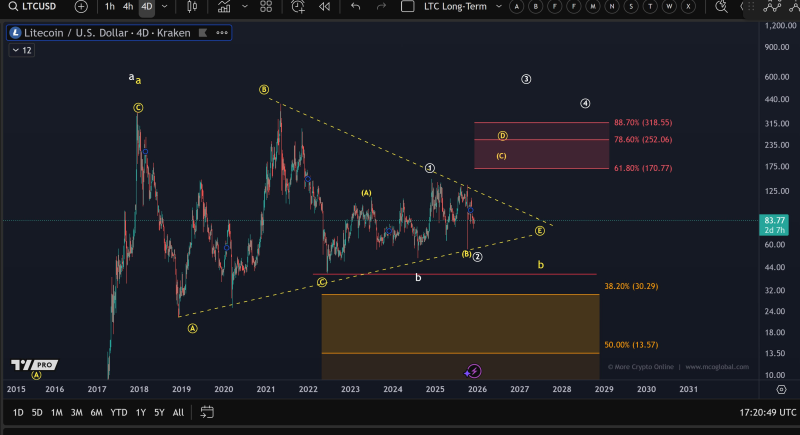
⬤ The chart displays a symmetrical triangle that connects major highs and lows from the past multiple years. The pattern allows brief excursions past its edges - a deeper D-wave remains possible. Under that reading, Litecoin would still be inside sub wave C of circle wave D plus could climb again toward the November peak.
⬤ Fibonacci grids on the chart flag the next resistance cluster between 170 USD and 318 USD. A straight thrust through the upper border - the white scenario - looks improbable today - yet either track leaves space for an eventual break upward. The same grids mark retracement levels near 30 USD and 13 USD - those marks sit on the long term map but are not short term objectives.
⬤ This compression matters because multi year coils often precede large moves. How Litecoin behaves at the triangle's main downtrend line but also at the November high will decide whether the slow yellow continuation still dominates or whether signs of an upward break begin to appear.
 Usman Salis