Peter Smith

⬤ Litecoin is moving through a textbook long-term consolidation on the 3-month chart. The cryptocurrency has been carving out a symmetrical triangle for several years now, bouncing between a descending resistance line and a rising support floor. Right now, LTC sits around the $80 mark, comfortably nestled inside this macro framework.
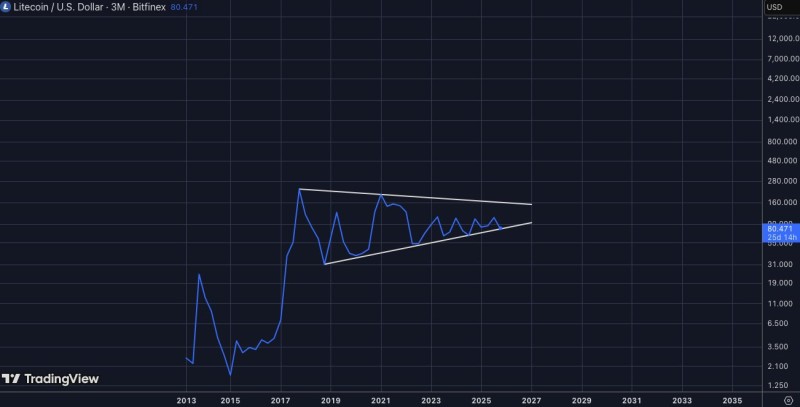
⬤ Since 2021, Litecoin has been printing lower highs while simultaneously building higher lows from the 2018 bottom. This gradual squeeze shows a market stuck in neutral—neither bulls nor bears have managed to tip the scales. The chart tells a straightforward story without any clutter, just clean price action doing what it does best.
⬤ Nobody's getting too excited about Litecoin right now, and the slow compression on the chart backs that up. There's no breakout brewing yet, no dramatic collapse either. LTC just keeps bouncing around inside its triangle like it's got all the time in the world.
⬤ What makes this setup worth watching is how long it's been cooking. Litecoin has spent multiple market cycles building this massive consolidation zone. When patterns stick around this long, they tend to mean something when they finally break. As the triangle narrows toward its apex, the 3-month chart remains the go-to reference for tracking where Litecoin might be headed next.
 Peter Smith